tabplot: Tableplot, a visualization of large datasets
大きめのデータセットの可視化ツール
- CRAN: http://cran.r-project.org/web/packages/tabplot/index.html
- GitHub: https://github.com/mtennekes/tabplot
> library(tabplot)
Loading required package: ffbase
Loading required package: ff
Loading required package: bit
Error: package 'bit' could not be loaded
バージョン: 1.1
| 関数名 | 概略 |
|---|---|
-.tabplot |
Compare two tableplots (experimental) |
bin_data |
Bin data |
bin_hcc_data |
Bin high cardinality data |
datetime2fac |
Transform a date-time vector to a factor |
itableplot |
Graphical User Interface to create tableplots |
num2fac |
Transform a numerical vector to a factor |
plot.tabplot |
Plot a tabplot-object |
print.tabplot |
Print a tabplot-object |
summary.tabplot |
Summarize a tabplot-object |
tableChange |
Change a tabplot-object |
tablePalettes |
Show / get all palettes of the tabplot package |
tablePrepare |
Prepares a dataset for tableplotting |
tableSave |
Save a tableplot |
tableplot |
Create a tableplot |
tabplot-object |
Object that contains the information to plot a tableplot |
tabplot-package |
Tableplot, a visualization of large datasets |
tabplot_compare-object |
Object that contains the information to plot the difference of two tableplots (experimental) |
tableplot
表プロットの作成
Arguments
- dat... 使用するデータフレーム
- select... 視覚化する変数。何も指定しなければデータフレームの全変数が対象となる
- subset...
- sortCol... 並び替えの基準にする変数
- decreasing... logic. 昇順か降順か
- nBins... integer. バンドの数
- from... データの範囲(下限)を指定
- to... データの範囲(上限)を指定
- nCols
- sample... logic. データの一部をリサンプリングする場合は
TRUE - sampleBinSize
- scales
- max_levels
- pals
- change_palette_type_at
- colorNA... 欠損値に使用する色
- numPals... 変数に使用する色
- limitsX
- bias_brokenX
- IQR_bias
- select_string
- subset_string
- colNames
- filter
- plot
- ...
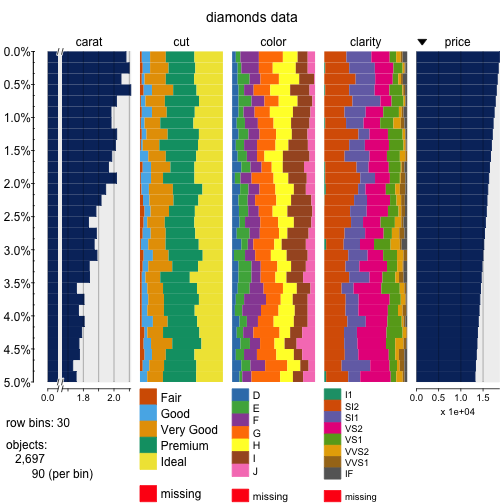
> tableplot(dat = diamonds,
+           select = c(carat, cut, color, clarity, price),
+           sortCol = price,
+           from = 0,
+           to = 5,
+           nBins = 30,
+           sample = TRUE,
+           title = "diamonds data",
+           fontsize = 12)