ggplot2: An Implementation of the Grammar of Graphics
作図のための文法
- CRAN: http://cran.r-project.org/web/packages/ggplot2/index.html
- GitHub: https://github.com/hadley/ggplot2
> library(ggplot2)
バージョン: 2.1.0
| 関数名 | 概略 |
|---|---|
+.gg |
Modify a ggplot or theme object by adding on new components. |
add_theme |
Modify properties of an element in a theme object |
aes |
Define aesthetic mappings. |
aes_ |
Define aesthetic mappings from strings, or quoted calls and formulas. |
aes_colour_fill_alpha |
Colour related aesthetics: colour, fill and alpha |
aes_group_order |
Aesthetics: group |
aes_linetype_size_shape |
Differentiation related aesthetics: linetype, size, shape |
aes_position |
Position related aesthetics: x, y, xmin, xmax, ymin, ymax, xend, yend |
alpha |
Create a transparent colour. |
annotate |
Create an annotation layer. |
annotation_custom |
Annotation: Custom grob. |
annotation_logticks |
Annotation: log tick marks |
annotation_map |
Annotation: maps. |
annotation_raster |
Annotation: High-performance rectangular tiling. |
as.list.ggproto |
Convert a ggproto object to a list |
as_labeller |
Coerce to labeller function |
autoplot |
Create a complete ggplot appropriate to a particular data type |
borders |
Create a layer of map borders. |
calc_element |
Calculate the element properties, by inheriting properties from its parents |
coord_cartesian |
Cartesian coordinates. |
coord_fixed |
Cartesian coordinates with fixed relationship between x and y scales. |
coord_flip |
Flipped cartesian coordinates. |
coord_map |
Map projections. |
coord_polar |
Polar coordinates. |
coord_trans |
Transformed cartesian coordinate system. |
cut_interval |
Cut up numeric vector into useful groups. |
diamonds |
Prices of 50,000 round cut diamonds |
economics |
US economic time series. |
element_blank |
Theme element: blank. This theme element draws nothing, and assigns no space |
element_line |
Theme element: line. |
element_rect |
Theme element: rectangle. |
element_text |
Theme element: text. |
expand_limits |
Expand the plot limits with data. |
facet_grid |
Lay out panels in a grid. |
facet_null |
Facet specification: a single panel. |
facet_wrap |
Wrap a 1d ribbon of panels into 2d. |
faithfuld |
2d density estimate of Old Faithful data |
format.ggproto |
Format a ggproto object |
fortify |
Fortify a model with data. |
fortify-multcomp |
Fortify methods for objects produced by 'multcomp' |
fortify.lm |
Supplement the data fitted to a linear model with model fit statistics. |
fortify.map |
Fortify method for map objects. |
fortify.sp |
Fortify method for classes from the sp package. |
geom_abline |
Lines: horizontal, vertical, and specified by slope and intercept. |
geom_bar |
Bars, rectangles with bases on x-axis |
geom_bin2d |
Add heatmap of 2d bin counts. |
geom_blank |
Blank, draws nothing. |
geom_boxplot |
Box and whiskers plot. |
geom_contour |
Display contours of a 3d surface in 2d. |
geom_count |
Count the number of observations at each location. |
geom_crossbar |
Vertical intervals: lines, crossbars & errorbars. |
geom_curve |
Line segments and curves. |
geom_density |
Display a smooth density estimate. |
geom_density2d |
Contours from a 2d density estimate. |
geom_dotplot |
Sot plot |
geom_errorbarh |
Horizontal error bars |
geom_freqpoly |
Histograms and frequency polygons. |
geom_hex |
Hexagon binning. |
geom_jitter |
Points, jittered to reduce overplotting. |
geom_label |
Textual annotations. |
geom_map |
Polygons from a reference map. |
geom_path |
Connect observations. |
geom_point |
Points, as for a scatterplot |
geom_polygon |
Polygon, a filled path. |
geom_quantile |
Add quantile lines from a quantile regression. |
geom_raster |
Draw rectangles. |
geom_ribbon |
Ribbons and area plots. |
geom_rug |
Marginal rug plots. |
geom_smooth |
Add a smoothed conditional mean. |
geom_spoke |
A line segment parameterised by location, direction and distance. |
geom_violin |
Violin plot. |
ggplot |
Create a new ggplot plot. |
ggproto |
Create a new ggproto object |
ggsave |
Save a ggplot (or other grid object) with sensible defaults |
ggtheme |
ggplot2 themes |
graphical-units |
Graphical units |
guide_colourbar |
Continuous colour bar guide. |
guide_legend |
Legend guide. |
guides |
Set guides for each scale. |
hmisc |
Wrap up a selection of summary functions from |
Hmisc |
to make it easy to use with 'stat_summary'. |
is.ggproto |
Is an object a ggproto object? |
is.rel |
Reports whether x is a rel object |
is.theme |
Reports whether x is a theme object |
label_bquote |
Backquoted labeller |
labeller |
Generic labeller function for facets |
labellers |
Labeller functions |
labs |
Change axis labels and legend titles |
last_plot |
Retrieve the last plot to be modified or created. |
layer |
Create a new layer |
lims |
Convenience functions to set the axis limits. |
luv_colours |
'colors()' in Luv space. |
map_data |
Create a data frame of map data. |
margin |
Define margins. |
mean_se |
Calculate mean and standard errors on either side. |
midwest |
Midwest demographics. |
mpg |
Fuel economy data from 1999 and 2008 for 38 popular models of car |
msleep |
An updated and expanded version of the mammals sleep dataset. |
position_dodge |
Adjust position by dodging overlaps to the side. |
position_fill |
Stack overlapping objects on top of one another. |
position_identity |
Don't adjust position |
position_jitter |
Jitter points to avoid overplotting. |
position_jitterdodge |
Adjust position by simultaneously dodging and jittering |
position_nudge |
Nudge points. |
presidential |
Terms of 10 presidents from Eisenhower to Bush W. |
print.ggplot |
Draw plot on current graphics device. |
print.ggproto |
Print a ggproto object |
qplot |
Quick plot |
rel |
Relative sizing for theme elements |
resolution |
Compute the "resolution" of a data vector. |
scale_alpha |
Alpha scales. |
scale_colour_brewer |
Sequential, diverging and qualitative colour scales from colorbrewer.org |
scale_colour_gradient |
Smooth gradient between two colours |
scale_colour_grey |
Sequential grey colour scale. |
scale_colour_hue |
Qualitative colour scale with evenly spaced hues. |
scale_continuous |
Continuous position scales (x & y). |
scale_date |
Position scale, date & date times |
scale_identity |
Use values without scaling. |
scale_linetype |
Scale for line patterns. |
scale_manual |
Create your own discrete scale. |
scale_shape |
Scale for shapes, aka glyphs. |
scale_size |
Scale size (area or radius). |
scale_x_discrete |
Discrete position. |
seals |
Vector field of seal movements. |
stat_ecdf |
Empirical Cumulative Density Function |
stat_ellipse |
Plot data ellipses. |
stat_function |
Superimpose a function. |
stat_qq |
Calculation for quantile-quantile plot. |
stat_summary_2d |
Bin and summarise in 2d (rectangle & hexagons) |
stat_summary_bin |
Summarise y values at unique/binned x x. |
stat_unique |
Remove duplicates. |
theme |
Set theme elements |
theme_update |
Get, set and update themes. |
translate_qplot_base |
Translating between qplot and base graphics |
translate_qplot_ggplot |
Translating between qplot and ggplot |
translate_qplot_lattice |
Translating between qplot and lattice |
txhousing |
Housing sales in TX. |
update_geom_defaults |
Modify geom/stat aesthetic defaults for future plots |
update_labels |
Update axis/legend labels |
aes
審美的属性の付加。ggplot()のmappingに渡した要素はすべてのレイヤーで適用される。
> aes(x = mpg, y = wt)
* x -> mpg
* y -> wt
coord_fixed
Arguments
- ratio アスペクト比
- xlim
- ylim
- expand logical.
> ggplot(mtcars, aes(mpg, wt)) +
+   geom_point() +
+   coord_fixed(ratio = 5)
coord_map
投影図
Arguments
- projection
- ...
- orientation
- xlim
- ylim
geom_bar
> ggplot(mpg, aes(class)) +
+   geom_bar()
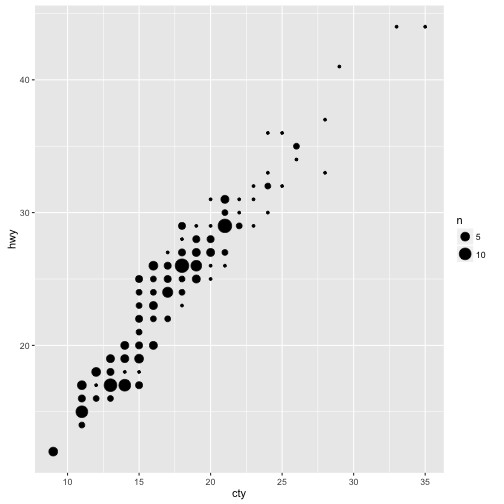
geom_count
> # ggplot(mpg, aes(cty, hwy)) +
> #  geom_point()
>
> ggplot(mpg, aes(cty, hwy)) +
+  geom_count()
ggplot
ggplotベースの図を作成する
Arguments
- data... data.frameクラスオブジェクトを想定。data.frameでない場合、
fortify()で変換すると良い。 - mapping...
aes() - ...
- environment
ggplotGrob
hmisc
{Hmisc}が提供する要約統計量を求める関数をggplot内で利用する
> mean_cl_boot()
> mean_cl_normal()
> mean_sdl()
> median_hilow()
map_data
地図データベースのデータフレーム作成
Arguments
- map...
{maps}パッケージを元にしている。country,france,italy,nz,state,usa,worldそしてworld2 - region
- exact
- ...
> states <- map_data("state")
> arrests <- USArrests
> names(arrests) <- tolower(names(arrests))
> arrests$region <- tolower(rownames(USArrests))
>
> choro <- merge(states, arrests, sort = FALSE, by = "region")
> choro <- choro[order(choro$order), ]
> ggplot(choro, aes(long, lat)) +
+   geom_polygon(aes(group = group, fill = assault)) +
+   coord_map("albers",  at0 = 45.5, lat1 = 29.5)
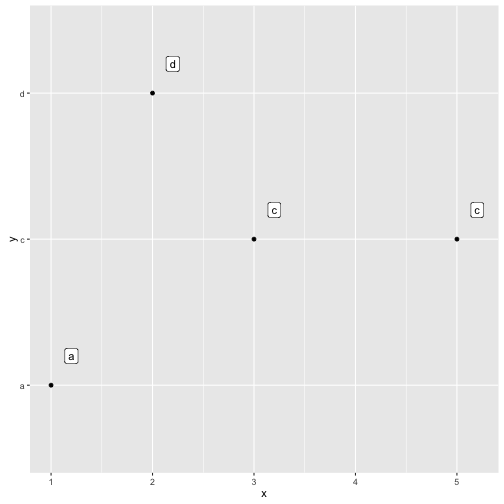
position_nudge
ラベル位置を微調整する際に役立つ関数
> data.frame(x = c(1,3,2,5),
+            y = c("a","c","d","c")) %>%
+   ggplot(mapping = aes(x, y)) +
+   geom_point() +
+   geom_label(mapping  = aes(label = y),
+              position = position_nudge(x = 0.2, y = 0.2))
stat_summary_bin
Arguments
- mapping
- data
- geom
- fun.data... ref)
hmisc() - fun.ymin, fun.y, fun.ymax
- fun.args
- na.rm
- position
- show.legend
- inherit.aes
- ...
> ggplot(mtcars, aes(cyl, mpg)) +
+   geom_point() +
+   stat_summary(fun.data = "mean_cl_boot", colour = "red", size = 2) +
+   stat_summary(fun.y = "median", colour = "red", size = 2) +
+   stat_summary(fun.y = "mean", colour = "red", size = 2)
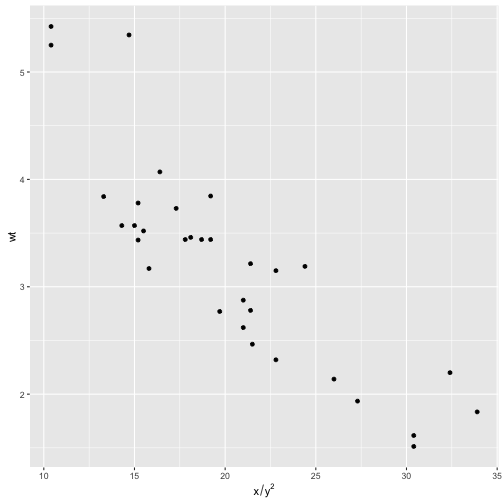
update_labels
軸や凡例のラベルを更新する
> p <- ggplot(mtcars, aes(mpg, wt)) +
+   geom_point()
> update_labels(p, list(x = expression(x / y ^ 2)))