DescTools: Tools for Descriptive Statistics
記述統計学のためのツール
- CRAN: http://cran.r-project.org/web/packages/DescTools/index.html
- Vignettes:
- Combinatorics (PDF)
- DescToolsCompanion (PDF)
- Tables In R (PDF)
- URL: http://www.stats.ox.ac.uk/pub/RWin/
> library(DescTools)
Attaching package: 'DescTools'
The following object is masked from 'package:data.tree':

    Sort
> data("d.pizza")
バージョン: 0.99.17
| 関数名 | 概略 |
|---|---|
%c% |
Concatenates two strings without any separator. |
%like% |
Like operator |
%nin% |
Find Matching (or Non-Matching) Elements |
%overlaps% |
Determines If And How Extensively Two Date Ranges Overlap |
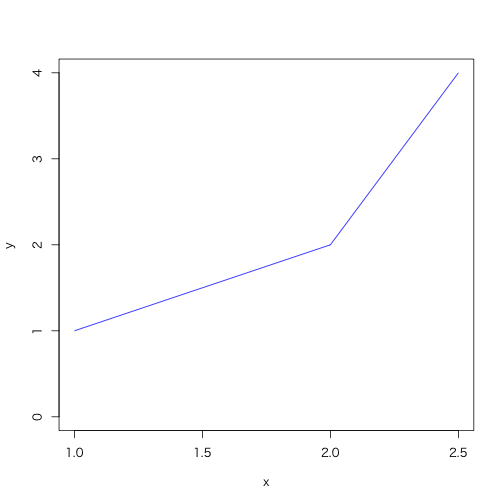
AUC |
Area Under the Curve |
AddMonths |
Add a Month to a Date |
Agree |
Raw Simple And Extended Percentage Agreement |
AllDuplicated |
Index Vector of All Values Involved in Ties |
AndersonDarlingTest |
Anderson-Darling Test of Goodness-of-Fit |
AscToChar |
Converts ASCII Codes to Characters and Vice Versa |
Assocs |
Association Measures |
Atkinson |
Calculate the Atkinson Index |
AxisBreak |
Place a Break Mark on an Axis |
BartelsRankTest |
Bartels Rank Test |
Benford |
Benford's Distribution |
Between |
Operators To Check, If a Value Lies Within Or Outside a Given Range |
BinToDec |
Converts numbers from binmode, octmode or hexmode to decimal and vice versa |
BinomCI |
Confidence Intervals for Binomial Proportions |
BinomDiffCI |
Confidence Interval for a Difference of Binomials |
BinomRatioCI |
Confidence Intervals for the Ratio of Binomial and Multinomial Proportions |
BoxCox |
Box Cox Transformation |
BoxCoxLambda |
Automatic Selection of Box Cox Transformation Parameter |
BoxedText |
Add Text in a Box to a Plot |
BreslowDayTest |
Breslow-Day Test for Homogeneity of the Odds Ratios |
BubbleLegend |
Add a Legend to a Bubble Plot |
CCC |
Concordance Correlation Coefficient |
Canvas |
Canvas for Geometric Plotting |
CartToPol |
Transform Cartesian to Polar/Spherical |
Coordinates |
and vice versa |
CatTable |
Function to write a table |
ChooseColorDlg |
Display Color Dialog to Choose a Color |
ClipToVect |
Reformat a Table in the Clipboard as Vector |
Clockwise |
Calculates Begin and End Angle From a List of |
Given |
Angles in Clockwise Mode |
Closest |
Find the Closest Value |
Coalesce |
Return the First Element Not Being NA |
CochranArmitageTest |
Cochran-Armitage test for trend |
CochranQTest |
Cochran's Q test |
CoefVar |
Coefficient of Variation |
CohenD |
Cohen's Effect Size |
CohenKappa |
Cohen's Kappa and Weighted Kappa |
ColToGrey |
Convert Colors to Grey/Grayscale |
ColToHex |
Convert a Color into Hex String |
ColToHsv |
R Color to HSV Conversion |
ColToRgb |
Color to RGB Conversion |
CollapseTable |
Collapse Levels of a Table |
ColorLegend |
Add a ColorLegend to a Plot |
ConDisPairs |
Concordant and Discordant Pairs |
Conf |
Confusion Matrix And Associated Statistics |
ConnLines |
Add Connection Lines to a Barplot |
Contrasts |
Pairwise Contrasts |
CorPolychor |
Polychoric Correlation |
CramerVonMisesTest |
Cramer-von Mises test for normality |
CronbachAlpha |
Cronbach's Coefficient Alpha |
CutQ |
Create a Factor Variable Using the Quantiles of a Continuous Variable |
Date |
Create a Date from Numeric Representation |
DegToRad |
Convert Degrees to Radians and vice versa |
DenseRank |
Dense Ranks |
Desc |
Describe Data |
Desc.Date |
Describe a Date Vector |
Desc.data.frame |
Describe a data.frame Or a List |
Desc.factor |
Describe a Factor, an Ordered Factor Or a Character Vector |
Desc.flags |
Describe a Set of Dichotomous Variables |
Desc.formula |
Describe Variables by Groups |
Desc.integer |
Describe an integer variable |
Desc.logical |
Describe a dichotomous variable |
Desc.numeric |
Describe a numeric vector |
Desc.table |
Describe a n-dimensional Contingency Table |
DescTools-package |
Tools for Efficient Descriptive Statistics |
DescWrd |
Use Word as Reporting Tool for Describing Data |
DivCoef |
Rao's diversity coefficient also called quadratic entropy |
DivCoefMax |
Maximal value of Rao's diversity coefficient also called quadratic entropy |
DrawAnnulus |
Draw One or Several Annuli |
DrawAnnulusSector |
Draw a Sector of an Annulus |
DrawArc |
Draw Elliptic or Circular Arc(s) |
DrawBand |
Draw Confidence Band |
DrawBezier |
Draw a Bezier Curve |
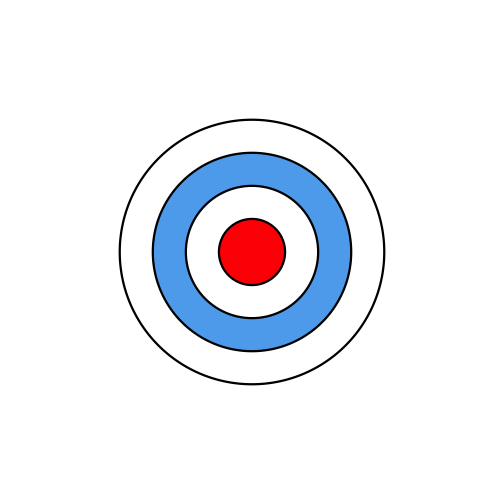
DrawCircle |
Draw a Circle |
DrawEllipse |
Draw an Ellipse |
DrawRegPolygon |
Draw Regular Polygon(s) |
Dummy |
Generate Dummy Codes for a Factor |
DunnTest |
Dunn's Test of Multiple Comparisons |
DunnettTest |
Dunnett's Test for Comparing Several Treatments With a Control |
DurbinWatsonTest |
Durbin-Watson Test |
Entropy |
Shannon Entropy and Mutual Information |
ErrBars |
Add Error Bars to an Existing Plot |
EtaSq |
Effect size calculations for ANOVAs |
Exec |
Execute a Command Given As String |
ExpFreq |
Expected frequencies |
Explore |
Interactive Graphical Data Explorer |
Factorize |
Prime Factorization of Integers |
FctArgs |
Retrieve a Functions' Arguments |
Fibonacci |
Fibonacci Numbers |
FindColor |
Get Color on a Defined Color Range |
FindCorr |
Determine highly correlated variables |
FisherZ |
Fisher r to z and z to r and confidence intervals |
FixToTab |
Text to Table |
Format |
Format Numbers and Dates |
Frac |
Return the Fractional Part of a Numeric Value |
Freq |
Frequency Table |
GCD |
Greatest Common Divisor and Least Common Multiple |
GTest |
G-Test for Count Data |
GetAllSubsets |
Get All Subsets out of a List of Elements |
GetCurrWrd |
Get a Handle to a Running Word Instance |
GetNewPP |
Create a new PowerPoint Instance |
GetNewWrd |
Create a new Word Instance |
GetNewXL |
Create a new Excel Instance |
GetPairs |
Get All Pairs out of one or two Sets of Elements |
Gini |
Gini Coefficient |
GiniSimpson |
Compute Gini-Simpson Coefficient |
Gmean |
Geometric Mean and Standard Deviation |
GoodmanKruskalGamma |
Goodman Kruskal's Gamma |
GoodmanKruskalTauA |
Goodman Kruskal's Tau a |
Herfindahl |
Concentration Measures |
HexToCol |
Identify closest match to a color given by a hexadecimal string |
HexToRgb |
Convert a Hexstring Color to a Matrix With Three Red/Green/Blue Rows |
HighLow |
Return the Lowest and the Highest Values and Their Frequencies |
Hmean |
Harmonic mean |
HmsToSec |
Convert h:m:s To/From Seconds |
HodgesLehmann |
Hodges-Lehmann Estimator of Location |
HoeffD |
Matrix of Hoeffding's D Statistics |
HotellingsT2Test |
Hotelling's T2 Test |
HuberM |
Safe (generalized) Huber M-Estimator of Location |
ICC |
Intraclass Correlations (ICC1, ICC2, ICC3 From Shrout and Fleiss) |
IdentifyA |
Identify Points in Plot Lying within a Rectangle or Polygon |
ImportDlg |
Get Path of a Data File to Be Opened |
ImportFileDlg |
Import File In Foreign Format |
InDots |
Is a Specific Argument in the Dots-Arguments? |
IsDate |
Check if an Object is of Type Date |
IsDichotomous |
Test If a Variable Contains Only Two Unique Values |
IsEuclid |
Is a Distance Matrix Euclidean? |
IsOdd |
Checks If An Integer Is Even Or Odd |
IsPrime |
IsPrime Property |
IsValidWrd |
Check Word Pointer |
IsWhole |
Check a Vector For Being Numeric, Zero Or a Whole Number |
JarqueBeraTest |
(Robust) Jarque Bera Test |
JonckheereTerpstraTest |
Exact Version of Jonckheere-Terpstra Test |
KappaM |
Kappa for m raters |
KendallTauB |
Kendall tau-b |
KendallW |
Kendall's Coefficient of Concordance W |
Keywords |
List valid Keywords for R man pages |
KrippAlpha |
Krippendorff's Alpha Reliability Coefficient |
LOCF |
Last Observation Carried Forward |
LOF |
Local Outlier Factor |
Label |
Label Attribute of an Object |
Lambda |
Goodman Kruskal Lambda |
Large |
Kth Smallest/Largest Values |
Lc |
Lorenz Curve |
LehmacherTest |
Lehmacher's Test for Marginal Homogenity |
LeveneTest |
Levene's Test for Homogeneity of Variance |
LillieTest |
Lilliefors (Kolmogorov-Smirnov) test for normality |
LinScale |
Perform a linear scaling of x |
LogLin |
Log Linear Hybrid, Generalized Log |
LogSt |
Started Logarithmic Transformation and Its Inverse |
Logit |
Generalized Logit and Inverse Logit function |
LsFct |
List Functions of a Package |
MHChisqTest |
Mantel-Haenszel Chi-Square Test |
Mar |
Set Plot Margins |
Mbind |
Bind k nxm-matrices with the same dimension |
MeanAD |
Mean Absolute Deviation From a Center Point |
MeanCI |
Confidence Interval for the Mean |
MeanDiffCI |
Confidence Interval For Difference of Means |
MeanSE |
Standard error of mean |
MedianCI |
Confidence Interval for the Median |
Midx |
Find the Midpoints of a Numeric Vector |
MixColor |
Compute the convex combination of two colors |
Mode |
Mode |
MosesTest |
Moses Test of Extreme Reactions |
MoveAvg |
Moving Average |
MultinomCI |
Confidence Intervals for Multinomial Proportions |
NPV |
One Period Returns, Net Present Value and Internal Rate of Return |
Ndec |
Count Decimal Places of a Number |
NemenyiTest |
Nemenyi Test |
OddsRatio |
Odds Ratio Estimation and Confidence Intervals |
Outlier |
Outlier |
PageTest |
Exact Page Test for Ordered Alternatives |
PairApply |
Pairwise Calculations |
PalDescTools |
Some Custom Palettes |
ParseFormula |
Parse a Formula and Create a Model Frame |
ParseSASDatalines |
Parse a SAS Dataline Command |
PartCor |
Find the Correlations for a Set x of Variables With Set y Removed |
| `PartitionBy PartitionBy Evaluates a Function Groupwise | |
PasswordDlg |
Password Dialog |
PearsonTest |
Pearson chi-square test for normality |
PercTable |
Percentage Table |
Permn |
Determine All Possible Permutations of a Set |
Phi |
Cramer's V, Pearson's Contingency Coefficient and Phi Coefficient Yule's Q and Y, Tschuprow's T |
PlotACF |
Combined Plot of a Time Series and its ACF and PACF |
PlotArea |
Create an Area Plot |
PlotBag |
PlotBag, a bivariate boxplot |
PlotBubble |
Draw a Bubble Plot |
PlotCandlestick |
Plot Candlestick Chart |
PlotCirc |
Plot Circular Plot |
PlotCorr |
Plot a Correlation Matrix |
PlotDesc |
Display descriptive plots |
PlotDot |
Cleveland's Dot Plots |
PlotDotCI |
Plot a Dotchart with Confidence Intervals |
PlotDotCIp |
Plot a Dotchart with Binomial Confidence Intervals |
PlotFaces |
Chernoff Faces |
PlotFdist |
Frequency Distribution Plot |
PlotFun |
Plot a Function |
PlotHorizBar |
Plot Horizontal Bars |
PlotLinesA |
Plot Lines |
PlotMarDens |
Scatterplot with Marginal Densities |
PlotMatrix |
Scatterplot Matrix |
PlotMonth |
Plot Monthly or Seasonal Effects Of a Univariate Time Series |
PlotMultiDens |
Plot Multiple Density Curves |
PlotPolar |
Plot Values on a Circular Grid |
PlotPyramid |
Draw a Back To Back Pyramid Plot |
PlotQQ |
QQ-Plot for Any Distribution |
PlotRCol |
Information plots |
PlotTernary |
Ternary or Triangular Plots. |
PlotTreemap |
Create a Treemap |
PlotVenn |
Plot a Venn Diagram |
PlotViolin |
Plot Violins Instead of Boxplots |
PlotWeb |
Plot a Web of Connected Points |
PoissonCI |
Poisson Confidence Interval |
PolarGrid |
Plot a Grid in Polar Coordinates |
PostHocTest |
Post-Hoc Tests |
PpPlot |
Add Slides, Insert Texts and Plots to PowerPoint |
Primes |
Find all Primes Less Than n |
PtInPoly |
Point in Polygon |
Ray |
Compact Information About the Columns of a Data Frame |
Recode |
Recode a Factor |
Recycle |
Recyle a List of Elements |
RelRisk |
Relative Risk |
Rename |
Change Names of a Named Object |
Rev |
Reverse Elements of a Vector or the Rows/Columns of Matrices and Tables |
RgbToCol |
Find the Named R-Color Which Is Nearest to a Given RGB-Color |
RndPairs |
Create Pairs of Correlated Random Numbers |
RobRange |
Robust Range |
RobScale |
Robust Scaling With Median and Mad |
Rotate |
Rotate a Geometric Structure |
RoundM |
Round to Multiple |
RunsTest |
Runs Test for Randomness |
SampleTwins |
Sample Twins |
SaveAsDlg |
Save R Objects By Choosing a File Interactively |
ScheffeTest |
Scheffe Test for Pairwise and Otherwise Comparisons |
SelectVarDlg |
Select Elements of a Set by Click |
SetAlpha |
Add an Alpha Channel To a Color |
ShapiroFranciaTest |
Shapiro-Francia test for normality |
SiegelTukeyTest |
Siegel-Tukey Test For Equality In Variability |
SignTest |
Sign Test |
Skew |
Skewness and Kurtosis |
SomersDelta |
Somers' Delta |
Sort |
Sort a Vector, a Matrix, a Table or a Data.frame |
SortMixed |
Order or Sort Strings With Embedded Numbers So |
That |
The Numbers Are In The Correct Order |
SpearmanRho |
Spearman Rank Correlation |
SplitPath |
Split Path In Drive, Path, Filename |
SpreadOut |
Spread Out a Vector of Numbers To a Minimum Interval |
Stamp |
Date/Time/Directory Stamp the Current Plot |
Str |
Compactly Display the Structure of an Arbitrary R Object |
StrAbbr |
String Abbreviation |
StrCap |
Capitalize the First Letter of a String |
StrChop |
Split a String in a Number of Pieces With Fixed Length |
StrCountW |
Count Words in a String |
StrDist |
Compute Distances Between Strings |
StrIsNumeric |
Does a String Contain Only Numeric Data |
StrPad |
Pad a String With Justification |
StrPos |
Find Position of First Occurrence Of a String |
StrRev |
Reverse a String |
StrRight |
Returns the Left Part Or the Right Part Of a String |
StrTrim |
Trim a string |
StrTrunc |
Truncate Strings and Add Ellipses If a String is Truncated. |
StrVal |
Extract All Numeric Values From a String |
Strata |
Stratified sampling |
StuartMaxwellTest |
Stuart-Maxwell Marginal Homogeneity Test |
StuartTauC |
Stuart Tau C |
SysInfo |
System Information And DescTools Options |
TextContrastColor |
Choose Textcolor Depending on Background Color |
TheilU |
Theil's U index of inequality |
ToWide |
Reshape a Vector From Long to Wide Shape Or Vice Versa |
Trim |
Trim a Vector |
TukeyBiweight |
Calculate Tukey's Biweight Robust Mean |
UncertCoef |
Uncertainty Coefficient |
UnitConv |
Unit Conversion |
Untable |
Recover Original Data From Contingency Table |
VarCI |
Confidence Interval for the Variance |
VecRot |
Vector Rotation |
Vigenere |
Vigenere Cypher |
Winsorize |
Winsorize |
WoolfTest |
Woolf Test |
WrdCaption |
Insert Caption to Word |
WrdInsTab |
Insert a Table in a Word Document |
WrdInsertBookmark |
Insert a Bookmark, Goto Bookmark and Update the Text of a Bookmark |
WrdPlot |
Insert Active Plot to Word |
WrdR |
Insert a R Command and It's Output in a Word Document |
WrdSetFont |
Set the Font in Word |
WrdTable |
Produces a Table in Word |
WrdText |
Insert Normal Text to Word |
XLGetRange |
Import Data Directly From Excel |
XLView |
Use Excel as Viewer for a Data.Frame |
Year |
Basic Date Functions |
YuenTTest |
Yuen t-Test For Trimmed Means |
ZTest |
Z Test for Known Population Standard Deviation |
ZeroIfNA |
Replace NAs by 0 |
Zodiac |
Calculate the Zodiac of a Date |
as.matrix.xtabs |
Xtabs to Matrix |
d.countries |
ISO 3166-1 Country Codes |
d.diamonds |
Data diamonds |
d.periodic |
Periodic Table of Elements |
d.pizza |
Data pizza |
day.name |
Build-in Constants Extension |
identify.formula |
Identify points in a plot using a formula. |
lines.lm |
Add a Linear Regression Line |
lines.loess |
Add a Loess or a Spline Smoother |
median.factor |
Median for Ordered Factors |
pRevGumbel |
"Reverse" Gumbel Distribution Functions |
power.chisq.test |
Power Calculations for ChiSquared Tests |
reorder.factor |
Reorder the Levels of a Factor |
split.formula |
Formula Interface for Split |
wdConst |
Word VBA constants |
%c%
文字列の結合演算子
> "foo" %c% "bar"
[1] "foobar"
%like%
AUC
Arguments
- x, y
- method...
trapezoid,steporspline - na.rm
> data.frame(x = c(1, 2, 2.5), y = c(1, 2, 4)) %$% {
+   AUC(x, y) %>% print()
+   plot(x, y, type = "l", col = "blue", ylim = c(0, 4))
+ }
> # [1] 3
ColToHex
> ColToHex(c("lightblue", "salmon"))
[1] "#ADD8E6" "#FA8072"
ColToHsv
> ColToHsv("peachpuff")
        [,1]
h 0.07857143
s 0.27450980
v 1.00000000
ColToRgb
> ColToRgb("peachpuff")
      [,1]
red    255
green  218
blue   185
Desc
データの要約
> Desc(d.pizza$wrongpizza)
-------------------------------------------------------------------------
d.pizza$wrongpizza (logical - dichotomous)

  length      n    NAs unique
   1'209  1'205      4      2

        freq   perc  lci.95  uci.95'
FALSE  1'122  93.1%   91.5%   94.4%
TRUE      83   6.9%    5.6%    8.5%

' 95%-CI Wilson
> Desc(iris)
-------------------------------------------------------------------------
Describe data.frame

'data.frame':    150 obs. of  5 variables:
 1 $ Sepal.Length: num  5.1 4.9 4.7 4.6 5 5.4 4.6 5 4.4 4.9 ...
 2 $ Sepal.Width : num  3.5 3 3.2 3.1 3.6 3.9 3.4 3.4 2.9 3.1 ...
 3 $ Petal.Length: num  1.4 1.4 1.3 1.5 1.4 1.7 1.4 1.5 1.4 1.5 ...
 4 $ Petal.Width : num  0.2 0.2 0.2 0.2 0.2 0.4 0.3 0.2 0.2 0.1 ...
 5 $ Species     : Factor w/ 3 levels "setosa","versicolor",..: 1 1 1 1 1 1 1 1 1 1 ...

-------------------------------------------------------------------------
1 - Sepal.Length (numeric)

  length       n     NAs  unique      0s    mean  meanSE
     150     150       0      35       0   5.843   0.068

     .05     .10     .25  median     .75     .90     .95
   4.600   4.800   5.100   5.800   6.400   6.900   7.255

   range      sd   vcoef     mad     IQR    skew    kurt
   3.600   0.828   0.142   1.038   1.300   0.309  -0.606

lowest : 4.3, 4.4 (3), 4.5, 4.6 (4), 4.7 (2)
highest: 7.3, 7.4, 7.6, 7.7 (4), 7.9

-------------------------------------------------------------------------
2 - Sepal.Width (numeric)

  length       n     NAs  unique      0s    mean  meanSE
     150     150       0      23       0   3.057   0.036

     .05     .10     .25  median     .75     .90     .95
   2.345   2.500   2.800   3.000   3.300   3.610   3.800

   range      sd   vcoef     mad     IQR    skew    kurt
   2.400   0.436   0.143   0.445   0.500   0.313   0.139

lowest : 2.0, 2.2 (3), 2.3 (4), 2.4 (3), 2.5 (8)
highest: 3.9 (2), 4.0, 4.1, 4.2, 4.4

-------------------------------------------------------------------------
3 - Petal.Length (numeric)

  length       n     NAs  unique      0s    mean  meanSE
     150     150       0      43       0    3.76    0.14

     .05     .10     .25  median     .75     .90     .95
    1.30    1.40    1.60    4.35    5.10    5.80    6.10

   range      sd   vcoef     mad     IQR    skew    kurt
    5.90    1.77    0.47    1.85    3.50   -0.27   -1.42

lowest : 1.0, 1.1, 1.2 (2), 1.3 (7), 1.4 (13)
highest: 6.3, 6.4, 6.6, 6.7 (2), 6.9

-------------------------------------------------------------------------
4 - Petal.Width (numeric)

  length       n     NAs  unique      0s    mean  meanSE
     150     150       0      22       0    1.20    0.06

     .05     .10     .25  median     .75     .90     .95
    0.20    0.20    0.30    1.30    1.80    2.20    2.30

   range      sd   vcoef     mad     IQR    skew    kurt
    2.40    0.76    0.64    1.04    1.50   -0.10   -1.36

lowest : 0.1 (5), 0.2 (29), 0.3 (7), 0.4 (7), 0.5
highest: 2.1 (6), 2.2 (3), 2.3 (8), 2.4 (3), 2.5 (3)

-------------------------------------------------------------------------
5 - Species (factor)

  length      n    NAs unique levels  dupes
     150    150      0      3      3      y

        level  freq   perc  cumfreq  cumperc
1      setosa    50  33.3%       50    33.3%
2  versicolor    50  33.3%      100    66.7%
3   virginica    50  33.3%      150   100.0%
d.pizza
ピザのデータ
> data("d.pizza")
> dplyr::glimpse(d.pizza)
Observations: 1,209
Variables: 16
$ index          <int> 1, 2, 3, 4, 5, 6, 7, 8, 9, 10, 11, 12, 13, 14, ...
$ date           <date> 2014-03-01, 2014-03-01, 2014-03-01, 2014-03-01...
$ week           <dbl> 9, 9, 9, 9, 9, 9, 9, 9, 9, 9, 9, 9, 9, 9, 9, 9,...
$ weekday        <dbl> 6, 6, 6, 6, 6, 6, 6, 6, 6, 6, 6, 6, 6, 6, 6, 6,...
$ area           <fctr> Camden, Westminster, Westminster, Brent, Brent...
$ count          <int> 5, 2, 3, 2, 5, 1, 4, NA, 3, 6, 3, 5, 4, 1, 6, 5...
$ rabate         <lgl> TRUE, FALSE, FALSE, FALSE, TRUE, FALSE, TRUE, N...
$ price          <dbl> 65.655, 26.980, 40.970, 25.980, 57.555, 13.990,...
$ operator       <fctr> Rhonda, Rhonda, Allanah, Allanah, Rhonda, Alla...
$ driver         <fctr> Taylor, Butcher, Butcher, Taylor, Carter, Tayl...
$ delivery_min   <dbl> 20.0, 19.6, 17.8, 37.3, 21.8, 48.7, 49.3, 25.6,...
$ temperature    <dbl> 53.00, 56.40, 36.50, NA, 50.00, 27.00, 33.90, 5...
$ wine_ordered   <int> 0, 0, 0, 0, 0, 0, 1, NA, 0, 1, 1, 0, 0, 1, 0, 0...
$ wine_delivered <int> 0, 0, 0, 0, 0, 0, 1, NA, 0, 1, 1, 0, 0, 1, 0, 0...
$ wrongpizza     <lgl> FALSE, FALSE, FALSE, FALSE, FALSE, FALSE, FALSE...
$ quality        <ord> medium, high, NA, NA, medium, low, low, high, h...
DrawCircle
> Canvas(xlim = c(-5,5))
> DrawCircle(radius = 4:1,
+            col    = c("white", "steelblue2", "white", "red"),
+            lwd = 3,
+            nv = 300)
Freq
> data(d.pizza)
> Freq(d.pizza$price) %>% kable()
| level | freq | perc | cumfreq | cumperc |
|---|---|---|---|---|
| [0,10] | 4 | 0.0033417 | 4 | 0.0033417 |
| (10,20] | 96 | 0.0802005 | 100 | 0.0835422 |
| (20,30] | 183 | 0.1528822 | 283 | 0.2364244 |
| (30,40] | 147 | 0.1228070 | 430 | 0.3592314 |
| (40,50] | 263 | 0.2197160 | 693 | 0.5789474 |
| (50,60] | 169 | 0.1411863 | 862 | 0.7201337 |
| (60,70] | 119 | 0.0994152 | 981 | 0.8195489 |
| (70,80] | 109 | 0.0910610 | 1090 | 0.9106099 |
| (80,90] | 68 | 0.0568087 | 1158 | 0.9674185 |
| (90,100] | 22 | 0.0183793 | 1180 | 0.9857978 |
| (100,110] | 7 | 0.0058480 | 1187 | 0.9916458 |
| (110,120] | 6 | 0.0050125 | 1193 | 0.9966583 |
| (120,130] | 3 | 0.0025063 | 1196 | 0.9991646 |
| (130,140] | 1 | 0.0008354 | 1197 | 1.0000000 |
HighLow
最小値と最大値を同時に算出する
> data(d.pizza)
> d.pizza %$% HighLow(temperature, na.rm = TRUE) %>% cat()
Error in HighLow(temperature, na.rm = TRUE): unused argument (na.rm = TRUE)
Outlier
外れ値を表示
> Outlier(d.pizza$temperature, na.rm = TRUE)
 [1] 20.00 20.45 22.20 20.35 22.10 21.30 21.00 21.60 21.70 21.80 22.20
[12] 22.50 20.40 21.90 19.40 20.20 19.30 20.20 22.40
ParseSASDatalines
Untable
> Untable(HairEyeColor) %>% head()
   Hair   Eye  Sex
1 Black Brown Male
2 Black Brown Male
3 Black Brown Male
4 Black Brown Male
5 Black Brown Male
6 Black Brown Male
> Untable(HairEyeColor) %>% str()
'data.frame':    592 obs. of  3 variables:
 $ Hair: Factor w/ 4 levels "Black","Brown",..: 1 1 1 1 1 1 1 1 1 1 ...
 $ Eye : Factor w/ 4 levels "Brown","Blue",..: 1 1 1 1 1 1 1 1 1 1 ...
 $ Sex : Factor w/ 2 levels "Male","Female": 1 1 1 1 1 1 1 1 1 1 ...
 - attr(*, "out.attrs")=List of 2
  ..$ dim     : Named int  4 4 2
  .. ..- attr(*, "names")= chr  "Hair" "Eye" "Sex"
  ..$ dimnames:List of 3
  .. ..$ Hair: chr  "Hair=Black" "Hair=Brown" "Hair=Red" "Hair=Blond"
  .. ..$ Eye : chr  "Eye=Brown" "Eye=Blue" "Eye=Hazel" "Eye=Green"
  .. ..$ Sex : chr  "Sex=Male" "Sex=Female"