ggExtra: Add Marginal Histograms to 'ggplot2', and More 'ggplot2' Enhancements
- CRAN: http://cran.r-project.org/web/packages/ggExtra/index.html
- GitHub: https://github.com/daattali/ggExtra
> library(ggExtra)
> library(ggplot2)
バージョン: 0.3.0
| 関数名 | 概略 |
|---|---|
ggExtra |
ggExtra |
ggMarginal |
Add marginal density/histogram to ggplot2 scatterplots |
plotCount |
Plot count data with ggplot2 |
removeGrid |
Remove grid lines from ggplot2 |
rotateTextX |
Rotate x axis labels |
runExample |
Run ggExtra example |
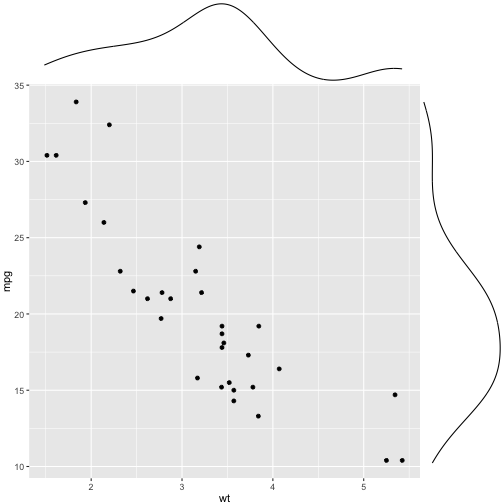
ggMarginal
{ggplot2}の散布図に周辺分布の図を追加する
> p <- ggplot(mtcars, ggplot2::aes(wt, mpg)) + geom_point()
> ggMarginal(p)
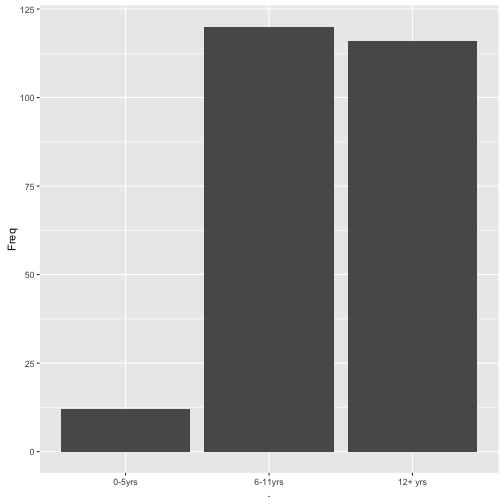
plotCount
カウントデータの可視化
> infert$education %>% table() %>% plotCount()
> data.frame(bloodtype = c("A", "B", "O", "AB"),
+            count     = c(5, 2, 3, 1)) %>%
+   plotCount() + removeGridX()
removeGrid
{ggplot2}の図から罫線を取り除く
> ggplot(mtcars, aes(wt, mpg)) +
+   geom_point() +
+   removeGrid()
rotateTextX
X軸の値を回転させる
> ggplot(mtcars, aes(wt, mpg)) +
+   geom_point() +
+   rotateTextX()
runExample
ShinyアプリとしてインタラクティブなggMarginal()のデモを実行
> runExample()