maps: Draw Geographical Maps
地図の描画
> library(maps)
バージョン: 3.0.0.2
| 関数名 | 概略 |
|---|---|
area.map |
Area of projected map regions |
canada.cities |
Database of Canadian cities |
county |
United States County Map |
county.fips |
FIPS county codes for US County Map |
france |
France Map |
identify.map |
Identify regions on a map |
iso.expand |
Identify countries by ISO 3166 codes (2 or 3 letters) or by Sovereignty. |
iso3166 |
ISO 3166 country codes (2 or 3 letters) and sovereignty. |
italy |
Italy Map |
legacy_world |
Legacy low resolution World Map. |
map |
Draw Geographical Maps |
map.axes |
Draw Axes on Geographical Maps |
map.cities |
Add Cities to Existing Map |
map.scale |
Add Scale to Existing Unprojected Map |
map.text |
Draw a map with labeled regions |
map.where |
Locate points on a map |
match.map |
Index map regions |
nz |
New Zealand Basic Map |
ozone |
Sample datasets |
smooth.map |
Smooth out aggregated data |
state |
United States State Boundaries Map |
state.carto |
United States State Population Cartogram Map |
state.fips |
FIPS state codes for US 48 State Map |
state.vbm |
United States State Visibility Base Map |
us.cities |
Database of US cities |
usa |
United States Coast Map |
world |
Low (mid) resolution World Map |
world.cities |
Database of world cities |
world.legacy |
Legacy world map |
world2 |
Pacific Centric Low resolution World Map |
map
地図を描画するための関数
Arguments
- database
- regions
- exact
- boundary
- interior
- projection
- parameters
- orientation
- fill
- col
- plot
- namesonly
- xlim
- ylim
- wrap
- resolution
- type
- bg
- mar
- myborder
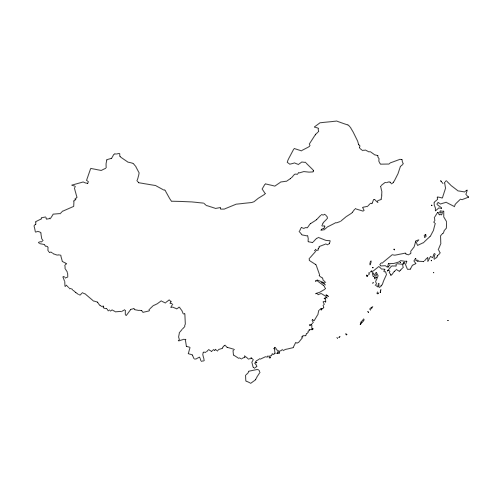
> map(database = "world",
+     regions = c("Japan", "China"))
map.axes
外側の枠を表示させる
map.cities
既存の地図に都市の位置をプロットする
Arguments
- x
- country
- label
- minpop
- mapop
- capitals... 表示する都市。
- 首都
- 地方の主要な都市
- 地域の都市
- cex
- projection
- parameters
- orientation
- pch
- ...
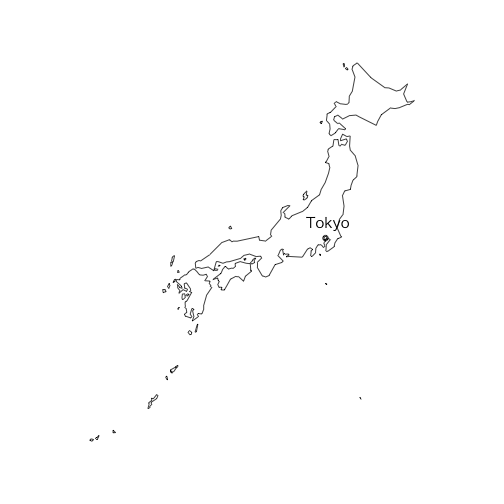
> map("world2", "Japan") # 日本の地図を描く
> map.cities(country = "Japan", capitals = 1) # 都市の位置に点を鬱
map.scale
縮尺を表示させる
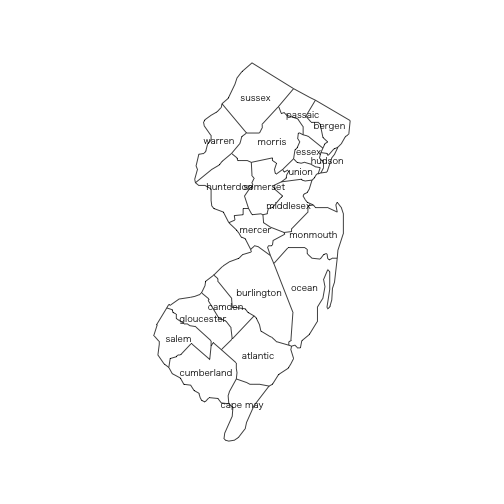
map.text
地名を表示
> map.text("county", "new jersey")
ozone
> data("ozone")
> str(ozone)
'data.frame':    41 obs. of  3 variables:
 $ x     : num  -74 -74.6 -74.7 -74.1 -74.3 ...
 $ y     : num  40.2 40.6 40.8 40.7 40.7 ...
 $ median: atomic  59 58 90 80 50 47 81 56 55 72 ...
  ..- attr(*, "Label")= chr "Median daily maxima for June to August"
us.cities
> data("us.cities")
> dplyr::glimpse(us.cities)
Observations: 1,005
Variables: 6
$ name        (chr) "Abilene TX", "Akron OH", "Alameda CA", "Albany GA...
$ country.etc (chr) "TX", "OH", "CA", "GA", "NY", "OR", "NM", "LA", "V...
$ pop         (int) 113888, 206634, 70069, 75510, 93576, 45535, 494962...
$ lat         (dbl) 32.45, 41.08, 37.77, 31.58, 42.67, 44.62, 35.12, 3...
$ long        (dbl) -99.74, -81.52, -122.26, -84.18, -73.80, -123.09, ...
$ capital     (int) 0, 0, 0, 0, 2, 0, 0, 0, 0, 0, 0, 0, 0, 0, 0, 0, 0,...
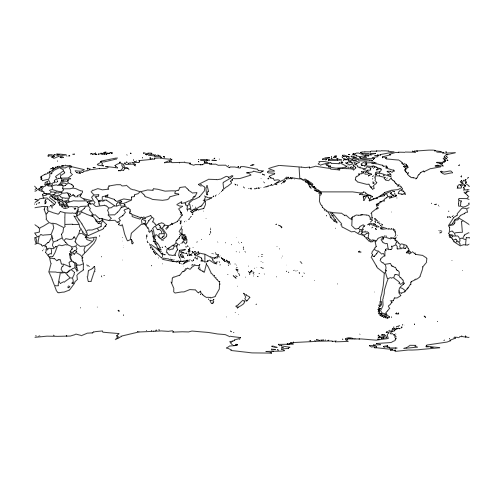
world
低(中)規模解像度での世界地図
> map('world', fill = TRUE, col = 1:10)
world2
太平洋を中心にした世界地図
> map("world2")