timevis: Create Interactive Timeline Visualizations in R
- CRAN: http://cran.r-project.org/web/packages/timevis/index.html
- GitHub: https://github.com/daattali/timevis
- URL: http://daattali.com/shiny/timevis-demo/
> library(timevis)
バージョン: 0.4
| 関数名 | 概略 |
|---|---|
addCustomTime |
Add a new vertical bar at a time point that can be dragged by the user |
addItem |
Add a single item to a timeline |
addItems |
Add multiple items to a timeline |
centerItem |
Move the window such that given item or items are centered |
centerTime |
Move the window such that the given time is centered |
fitWindow |
Adjust the visible window such that it fits all items |
removeCustomTime |
Remove a custom time previously added |
removeItem |
Remove an item from a timeline |
runExample |
Run examples of using timevis in a Shiny app |
setGroups |
Set the groups of a timeline |
setItems |
Set the items of a timeline |
setOptions |
Update the configuration options of a timeline |
setSelection |
Select one or multiple items on a timeline |
setWindow |
Set the current visible window |
timevis |
Create a timeline visualization |
timevis-shiny |
Shiny bindings for timevis |
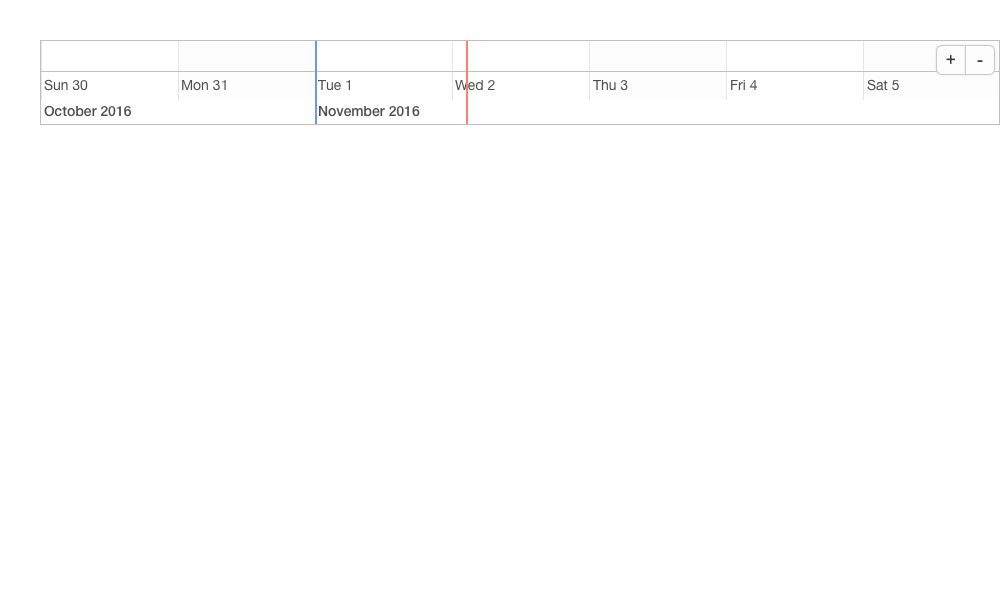
addCustomTime
> timevis() %>%
+   addCustomTime(Sys.Date() - 1, "yesterday")
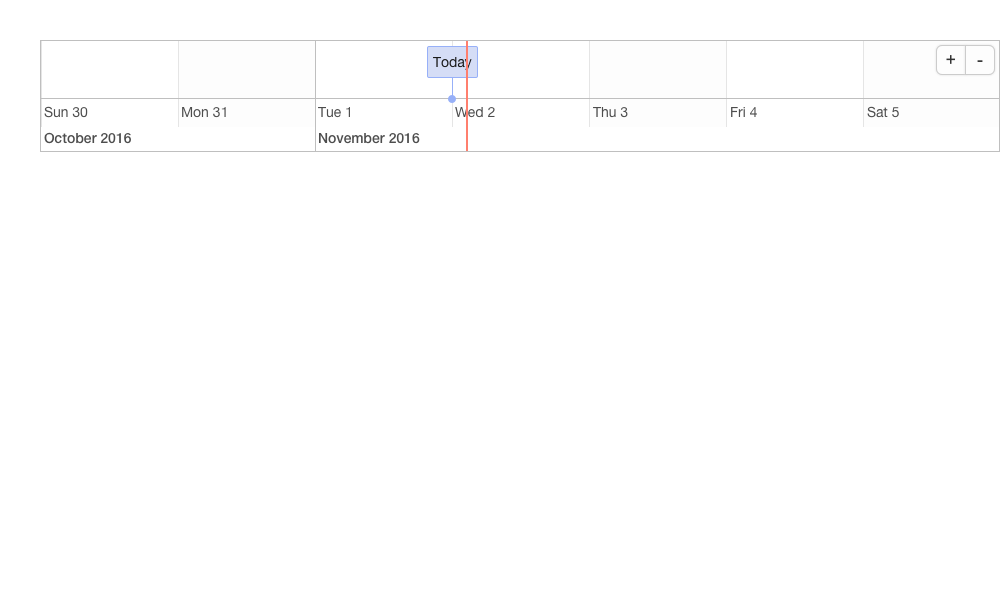
addItem
Arguments
- id
- data
> timevis() %>%
+   addItem(list(start = Sys.Date(), content = "Today"))
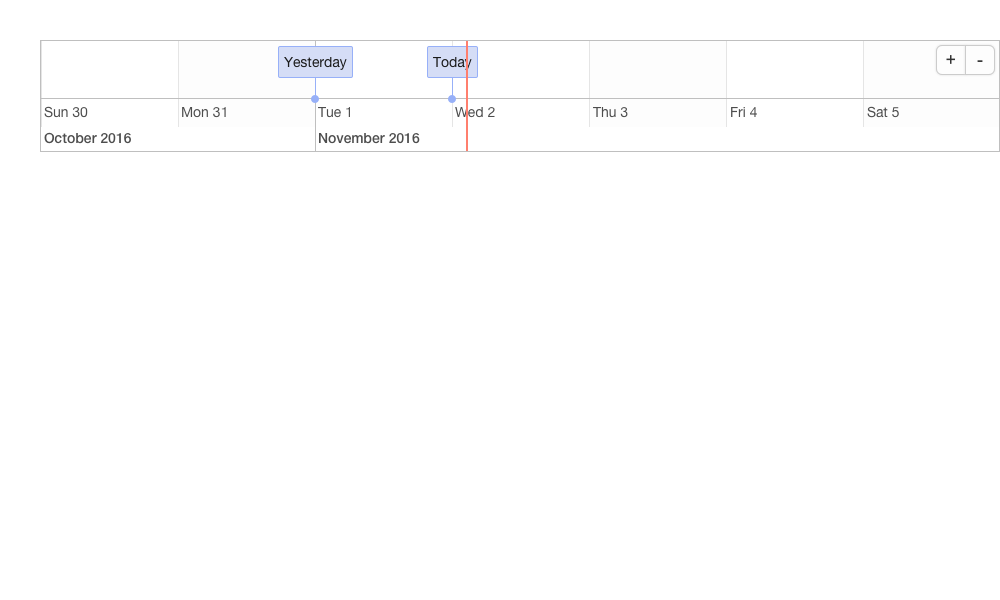
addItems
> timevis() %>%
+   addItems(data.frame(start = c(Sys.Date(), Sys.Date() - 1),
+            content = c("Today", "Yesterday")))
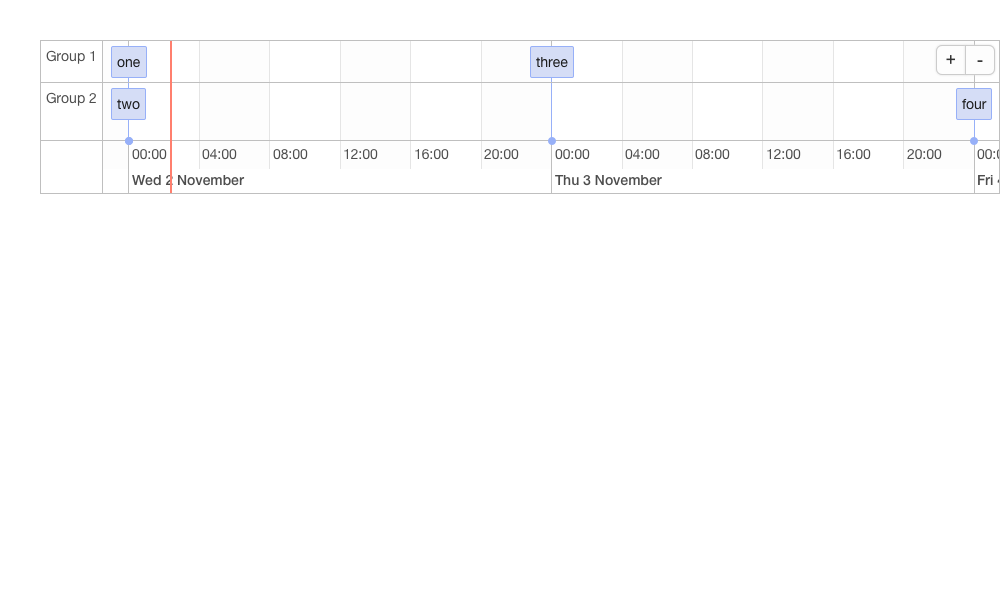
setGroups
> timevis(data = data.frame(
+   start = c(Sys.Date(), Sys.Date(), Sys.Date() + 1, Sys.Date() + 2),
+   content = c("one", "two", "three", "four"),
+   group = c(1, 2, 1, 2)),
+   groups = data.frame(id = 1:2, content = c("G1", "G2"))
+ ) %>%
+   setGroups(data.frame(id = 1:2, content = c("Group 1", "Group 2")))
timevis
Arguments
- data
- groups
- showZoom
- zoomFactor
- fit
- options
- width
- height
- elementId
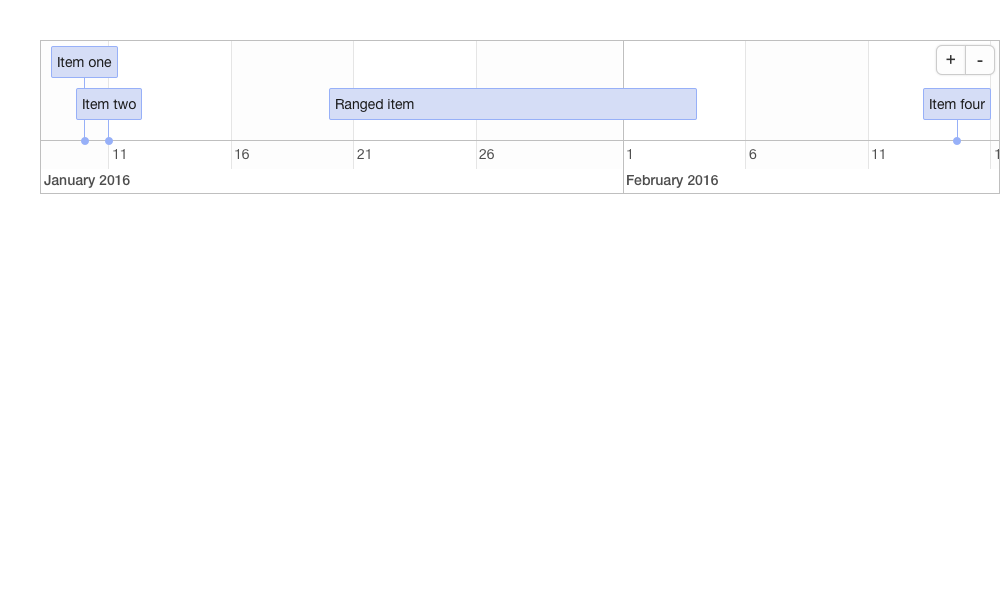
> data <- data.frame(
+   id      = 1:4,
+   content = c("Item one", "Item two", "Ranged item", "Item four"),
+   start   = c("2016-01-10", "2016-01-11", "2016-01-20", "2016-02-14 15:00:00"),
+   end     = c(NA, NA, "2016-02-04", NA)
+ )
>
> timevis(data)