highcharter: A Wrapper for the 'Highcharts' Library
- CRAN: http://cran.r-project.org/web/packages/highcharter/index.html
- GitHub: https://github.com/jbkunst/highcharter
- URL: http://jkunst.com/highcharter
> library(highcharter)
> data("citytemp")
> data(economics, package = "ggplot2")
バージョン: 0.3.1.9999
| 関数名 | 概略 |
|---|---|
citytemp |
City temperatures from a year |
datetime_to_timestamp |
Date to Timesstamps |
fa_icon |
Helpers functions to get FontAwesome icons code |
favorite_bars |
Marshall's Favorite Bars |
favorite_pies |
Marshall's Favorite Pies |
hc_add_series |
Adding and removing series from highchart objects |
hc_add_series_flags |
Shorcut for add flags to highstock chart |
hc_add_series_labels_values |
Shorcut for add series for pie, bar and column charts |
hc_add_series_map |
Shorcut for create map |
hc_add_series_ohlc |
Shorcut for create candlestick charts |
hc_add_series_scatter |
Shorcut for create scatter plots |
hc_add_series_times_values |
Shorcut for create/add time series from times and values |
hc_add_series_treemap |
Shorcut for create treemaps |
hc_add_series_ts |
Shorcut for create/add time series charts from a ts object |
hc_add_series_xts |
Shorcut for create highstock chart from 'xts' object |
hc_add_theme |
Add themes to a highchart object |
hc_annotations |
Adding annotations to highcharts objects |
hc_chart |
Adding chart options to highchart objects |
hc_colorAxis |
Adding Color Axis options to highchart objects |
hc_credits |
Adding credits options to highchart objects |
hc_defs |
Adding patterns to be used in highcharts series |
hc_demo |
Chart a demo for testing themes |
hc_drilldown |
Drilldown options for higcharts objects |
hc_exporting |
Exporting options for higcharts objects |
hc_get_colors |
Get default colors for Highcharts theme |
hc_get_dash_styles |
Get dash styles |
hc_legend |
Adding legend options to highchart objects |
hc_mapNavigation |
Adding mapNavigation options to highmaps charts |
hc_navigator |
Adding navigator options to highstock charts |
hc_plotOptions |
Adding plot options to highchart objects |
hc_rangeSelector |
Adding scrollbar options to highstock charts |
hc_rm_series |
Removing series to highchart objects |
hc_scrollbar |
Adding scrollbar options to highstock objects |
hc_series |
Series options from highchart objects |
hc_theme |
Highchart theme constructor |
hc_theme_538 |
Fivethirtyeight theme for highcharts |
hc_theme_chalk |
Chalk theme for highcharts |
hc_theme_darkunica |
Dark Unica theme for highcharts |
hc_theme_db |
Dotabuff theme for highcharts |
hc_theme_economist |
Fivethirtyeight theme for highcharts |
hc_theme_google |
Google theme for highcharts |
hc_theme_gridlight |
Grid Light theme for highchart |
hc_theme_handdrawn |
Hand Drawn theme for highcharts |
hc_theme_merge |
Merge themes |
hc_theme_null |
Null theme for highcharts |
hc_theme_sandsignika |
Sand Signika theme for highcharts |
hc_title |
Adding title and subtitle options to highchart objects |
hc_tooltip |
Adding tooltip options to highchart objects |
hc_xAxis |
Adding axis options to highchart objects |
hchart |
Create a highchart object from a particular data type |
higcharter |
An 'htmlwidget' interface to the Highcharts javascript chart library |
highcarter-exports |
highcharter exported operators and S3 methods |
highchart |
Create a Highcharts chart widget |
highchart2 |
Create a Highcharts chart widget |
highchartOutput |
Widget output function for use in Shiny |
list.parse2 |
Convert an object to list with identical structure |
renderHighchart |
Widget render function for use in Shiny |
str_to_id |
String to 'id' format |
unemployment |
US Counties unemployment rate |
uscountygeojson |
US Counties map in Geojson format (list) |
usgeojson |
US States map in Geojson format (list) |
worldgeojson |
World map in Geojson format (list) |
fa_icon
fontawesomeアイコンを利用するための便利な関数
Arguments
- iconname
> fa_icon("car")
[1] "<i class=\"fa fa-car\"></i>"
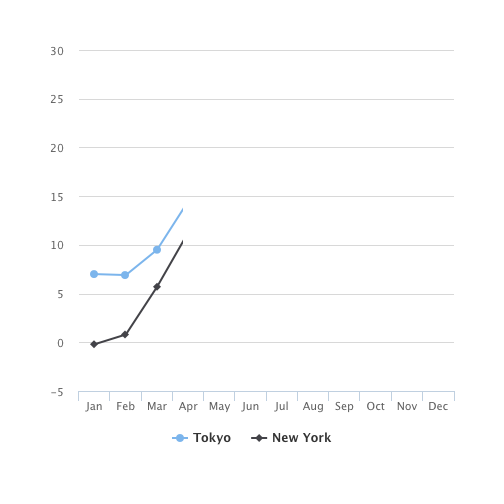
hc_add_series
> highchart() %>%
+   hc_xAxis(categories = citytemp$month) %>%
+   hc_add_series(name = "Tokyo", data = citytemp$tokyo) %>%
+   hc_add_series(name = "New York", data = citytemp$new_york)
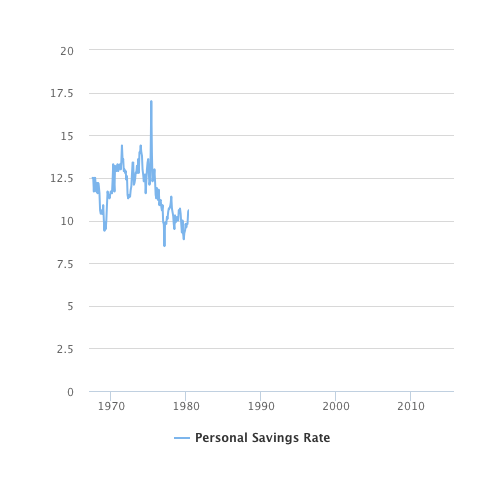
hc_add_series_times_values
> hc_add_series_times_values(hc = highchart(),
+                            dates = economics$date,
+                            values = economics$psavert,
+                            name = "Personal Savings Rate")
usgeojson
> data("usgeojson")
> usgeojson %>% class()
[1] "list"
worldgeojson
> data("worldgeojson")
> worldgeojson %>% class()
[1] "list"