smatr: (Standardised) Major Axis Estimation and Testing Routines
> library(smatr)
Loading required package: plyr
-------------------------------------------------------------------------
You have loaded plyr after dplyr - this is likely to cause problems.
If you need functions from both plyr and dplyr, please load plyr first, then dplyr:
library(plyr); library(dplyr)
-------------------------------------------------------------------------

Attaching package: 'plyr'

The following object is masked from 'package:maps':

    ozone

The following objects are masked from 'package:Hmisc':

    is.discrete, summarize

The following objects are masked from 'package:dplyr':

    arrange, count, desc, failwith, id, mutate, rename, summarise,
    summarize
> library(dplyr)
バージョン: 3.4.3
| 関数名 | 概略 |
|---|---|
coef.sma |
Extract coefficients from a 'sma' or 'ma' fit |
elev.com |
Test for equal elevation among several lines fitted with (standardised) major axes of common slope. |
elev.test |
One-sample test of a (standardised) major axis elevation |
fitted.sma |
Returns fitted values |
leaflife |
Leaf longevity and leaf mass per area for plant species from different sites |
leafmeas |
Leaf mass per area and photosynthetic rate for plant species from different sites |
line.cis |
Slope and elevation of a (standardised) major axis, with confidence intervals |
makeLogMinor |
Generate spacing for minor tick marks on a plot with log-scaled axes |
meas.est |
Measurement error variance estimation from repeated measures |
multcompmatrix |
Multiple comparisons graphical matrix |
plot.sma |
Draw an X-Y plot |
plotutils |
Utility plotting functions |
print.sma |
Print an object of class 'sma'. |
residuals.sma |
Extract model residuals |
seqLog |
Sequence Generation |
shift.com |
Test for no mean shift along a common (standardised) major axis |
slope.com |
Common slope test amongst several allometric lines |
slope.test |
One-sample test of a (standardised) major axis slope |
sma |
(Standardized) major axis estimation and testing for one or several samples |
smatr-package |
(Standardised) Major Axis Estimation and Testing Routines |
summary.sma |
Print a summary |
leaflife (データセット)
> data("leaflife")
> str(leaflife)
'data.frame':    67 obs. of  5 variables:
 $ site  : Factor w/ 4 levels "1","2","3","4": 1 1 1 1 1 1 1 1 1 1 ...
 $ rain  : Factor w/ 2 levels "high","low": 1 1 1 1 1 1 1 1 1 1 ...
 $ soilp : Factor w/ 2 levels "high","low": 1 1 1 1 1 1 1 1 1 1 ...
 $ longev: num  1.115 0.516 0.972 0.672 1.095 ...
 $ lma   : num  125.5 82.3 71 94.7 119.7 ...
> # site... 種の形質データを調査した地点コード
> # rain... 各siteの年降雨量の区分(high or low)
> # solip... 各siteにおける土壌窒素濃度の水準(high or low)
> # longev... 葉寿命(単位は年)
> # lma... 葉の面積あたりの重量(m2/kg)
> summary(leaflife)
 site     rain     soilp        longev            lma
 1:17   high:34   high:40   Min.   :0.5162   Min.   : 56.94
 2:17   low :33   low :27   1st Qu.:1.0100   1st Qu.:116.05
 3:23                       Median :1.4591   Median :153.60
 4:10                       Mean   :1.6676   Mean   :162.12
                            3rd Qu.:2.1318   3rd Qu.:202.79
                            Max.   :4.7304   Max.   :333.89
sma:
II型回帰モデル。複数ある形式にも対応。
leaflife %>% filter(soilp == "low", rain == "low") %>%
> leaflife %$% ma(longev ~ lma, log = 'xy', data = .) # MA
Call: sma(formula = ..1, data = ..3, log = "xy", method = "MA")

Fit using Major Axis

These variables were log-transformed before fitting: xy

Confidence intervals (CI) are at 95%

------------------------------------------------------------
Coefficients:
            elevation    slope
estimate    -3.085214 1.492616
lower limit -3.968020 1.146777
upper limit -2.202407 2.001084

H0 : variables uncorrelated
R-squared : 0.4544809
P-value : 0.00000000040171
回帰が有意なものであるか(slope = 1)を検証
> leaflife %$% ma(longev ~ lma, log = 'xy', slope.test = 1, data = .) %T>%
+   summary(.) -> res
Call: sma(formula = ..1, data = ..4, log = "xy", method = "MA", slope.test = 1)

Fit using Major Axis

These variables were log-transformed before fitting: xy

Confidence intervals (CI) are at 95%

------------------------------------------------------------
Coefficients:
            elevation    slope
estimate    -3.085214 1.492616
lower limit -3.968020 1.146777
upper limit -2.202407 2.001084

H0 : variables uncorrelated
R-squared : 0.4544809
P-value : 0.00000000040171

------------------------------------------------------------
H0 : slope not different from 1
Test statistic : r= 0.3515 with 65 degrees of freedom under H0
P-value : 0.0035393
0.0035393 であるので1より有意(P < 0.05)に異なる傾き slopeであるという結果となった
残差プロットを描く
> plot(res, type = "residual")
(なにも描画されない??)
> # 土壌窒素濃度が低いサイトのデータを抽出
> leaf.low.soilp <- filter(leaflife, soilp == "low")
Error in filter(leaflife, soilp == "low"): object 'soilp' not found
> # nrow(leaf.low.soilp) # 27
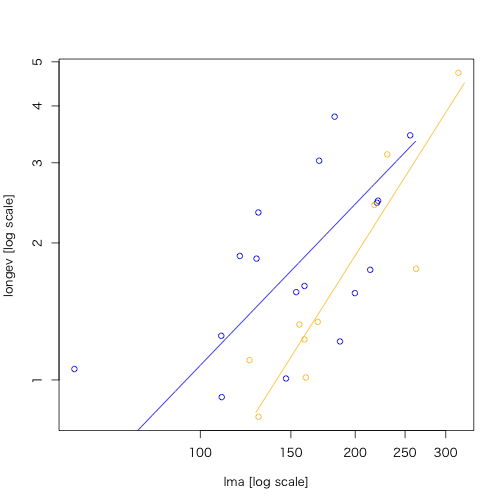
降水量の高いサイト、低いサイトそれぞれでSMAによる当てはめ、傾きの違いを比較
> leaf.low.soilp %>% sma(formula = "longev ~ lma * rain",
+                        log = "xy", data = .) %>% {
+   print(.)
+   plot(.)
+ }
年降雨量の多さ(high and low)が葉寿命に効いていないという帰無仮説H0に対して、P = 0.12395が得られた。帰無仮説を棄却することはできないということになる。