GGally: Extension to ggplot2.
{ggplot2}の拡張
> library(GGally)
Warning: replacing previous import by 'grid::arrow' when loading 'GGally'
Warning: replacing previous import by 'grid::unit' when loading 'GGally'
> data("flea")
バージョン: 0.5.0
| 関数名 | 概略 |
|---|---|
+.gg |
Modify a ggpairs object by adding an ggplot2 object to all plots |
add_ref_boxes |
Add reference boxes around each cell of the glyphmap. |
add_ref_lines |
Add reference lines for each cell of the glyphmap. |
cityServiceFirms |
City and service firms data from the UCIrvine Network Data Repository |
flea |
Historical data used for classification examples. |
get.VarTypes |
Get vector of variable types from data frame |
getPlot |
getPlot |
ggally_barDiag |
Plots the Bar Plots by Using Diagonal |
ggally_blank |
Blank |
ggally_box |
Plots the Box Plot |
ggally_cor |
Correlation from the Scatter Plot |
ggally_density |
Plots the Scatter Density Plot |
ggally_densityDiag |
Plots the Density Plots by Using Diagonal |
ggally_denstrip |
Plots a tile plot with facets |
ggally_diagAxis |
Internal Axis Labeling Plot for ggpairs |
ggally_dot |
Plots the Box Plot with Dot |
ggally_dotAndBox |
Plots either Box Plot or Dot Plots |
ggally_facetbar |
Plots the Bar Plots Faceted by Conditional Variable |
ggally_facetdensity |
Plots the density plots by faceting |
ggally_facetdensitystrip |
Plots a density plot with facets or a tile plot with facets |
ggally_facethist |
Plots the Histograms by Faceting |
ggally_points |
Plots the Scatter Plot |
ggally_ratio |
Plots a mosaic plots |
ggally_smooth |
Plots the Scatter Plot with Smoothing |
ggally_text |
GGplot Text |
ggcorr |
ggcorr - Plot a correlation matrix with ggplot2 |
ggfluctuation2 |
Fluctuation plot |
ggnet |
ggnet - Plot a network with ggplot2 |
ggpairs |
ggpairs - A GGplot2 Matrix |
ggparcoord |
ggparcoord - A ggplot2 Parallel Coordinate Plot |
ggscatmat |
ggscatmat - a traditional scatterplot matrix for purely quantitative variables |
ggsurv |
Plot 'survfit' objects using 'ggplot2' |
glyphs |
Create the data needed to generate a glyph plot. |
happy |
Data related to happiness from the General Social Survey, 1972-2006. |
lowertriangle |
lowertriangle - rearrange dataset as the preparation of ggscatmat function |
nasa |
Data from the Data Expo JSM 2006. |
putPlot |
Put Plot |
scagOrder |
Find order of variables |
scatmat |
scatmat - plot the lowertriangle plots and density plots of the scatter plot matrix. |
singleClassOrder |
Order axis variables |
skewness |
Sample skewness |
uppertriangle |
uppertriangle - rearrange dataset as the preparation of ggscatmat function |
flea
甲虫の体の大きさを測定したデータセット
> data("flea")
> flea %>% {
+   class(.) %>% print()
+   dplyr::tbl_df(.)
+ }
[1] "data.frame"
Source: local data frame [74 x 7]

    species tars1 tars2  head aede1 aede2 aede3
     (fctr) (int) (int) (int) (int) (int) (int)
1  Concinna   191   131    53   150    15   104
2  Concinna   185   134    50   147    13   105
3  Concinna   200   137    52   144    14   102
4  Concinna   173   127    50   144    16    97
5  Concinna   171   118    49   153    13   106
6  Concinna   160   118    47   140    15    99
7  Concinna   188   134    54   151    14    98
8  Concinna   186   129    51   143    14   110
9  Concinna   174   131    52   144    14   116
10 Concinna   163   115    47   142    15    95
..      ...   ...   ...   ...   ...   ...   ...
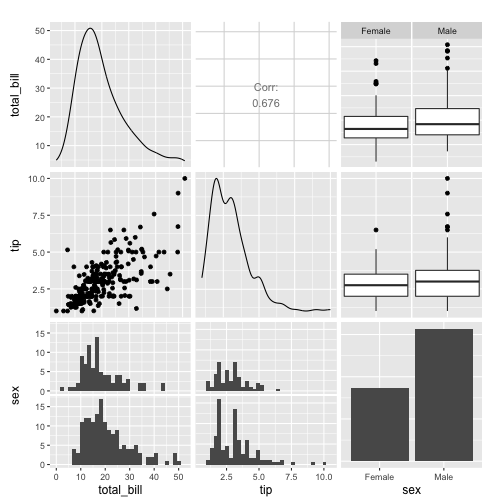
ggpairs
> data("tips", package = "reshape")
> ggpairs(tips[,1:3])
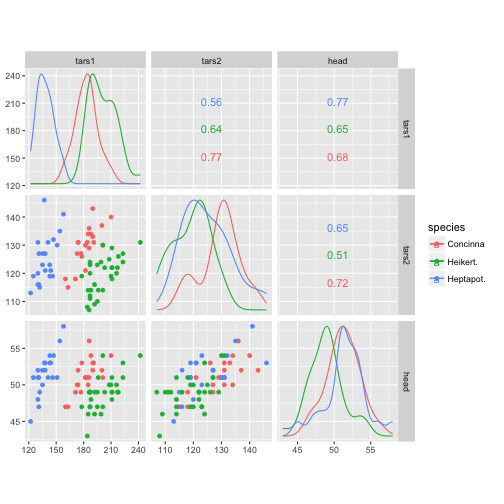
ggscatmat
散布図行列
> ggscatmat(flea, columns = 2:4, color = "species")