downscale: Downscaling Species Occupancy
- CRAN: http://cran.r-project.org/web/packages/downscale/index.html
- Vignettes:
> library(downscale)
> data.file <- system.file("extdata", "atlas_data.txt", package = "downscale")
> atlas.data <- read.table(data.file, header = TRUE)
バージョン: 1.2.3
| 関数名 | 概略 |
|---|---|
downscale |
Model area of occupancy against grain size for downscaling |
downscale-package |
Downscaling Species Occupancy |
ensemble.downscale |
Ensemble modelling of multiple downscaling functions |
hui.downscale |
Predict occupancy at fine grain sizes using the Hui model |
plot.predict.downscale |
Plotting of downscaled occupancy at fine grain sizes |
predict.downscale |
Predict occupancy at fine grain sizes |
upgrain |
Upgraining of atlas data to larger grain sizes |
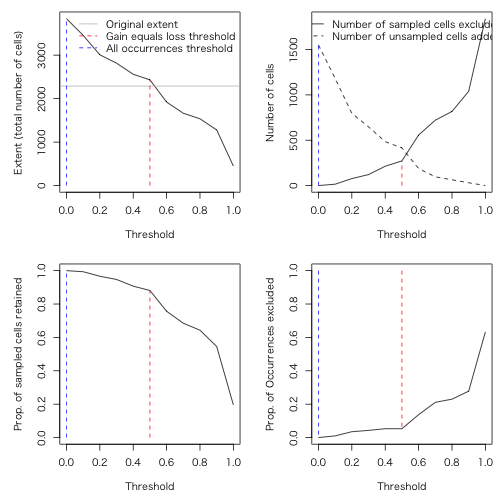
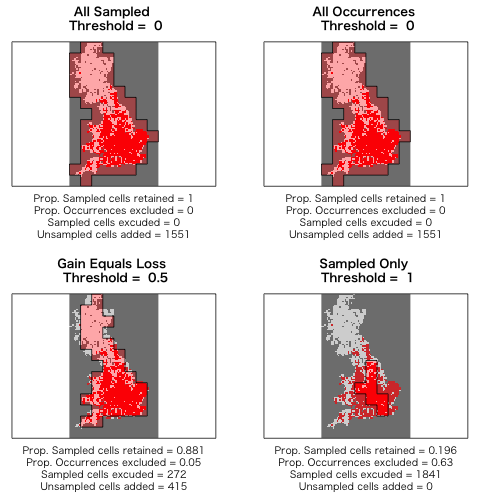
upgrain.threshold |
Exploration of trade-offs in threshold selection for upgraining |
downscale
Arguments
- occupancies
- model...
Nachman,PL,Logis,Poisson,NB,GNB,INB,FNB,Thomas - extent
- tolerance
- starting_params
> tail(atlas.data)
>
> # thresh <- upgrain.threshold(atlas.data = atlas.data,
> #                             cell.width = 10,
> #                             scales = 3,
> #                             thresholds = seq(0, 1, 0.1))
>
> occupancy <- upgrain(atlas.data,
+                      cell.width = 10,
+                      scales = 3,
+                      plot = FALSE,
+                      method = "All_Sampled")
>
> ## Logistic model
> (logis <- downscale(occupancies = occupancy,
+                     model = "Logis"))
>
> ### predict occupancy at finer grain sizes
> pred <- predict(logis,
+                 new.areas = c(1, 2, 5, 25, 100, 400, 1600, 6400))
>
> ### Plot predictions
> plot(pred)
ensemble.downscale
> ## upgrain data (using All Samples threshold)
> occupancy <- upgrain(atlas.data,
+                      cell.width = 10,
+                      scales = 3,
+                      method = "All_Sampled",
+                      plot = FALSE)
>
> ## ensemble downscaling with an object of class upgrain
> ensemble.downscale(occupancies = occupancy,
+                    new.areas = c(1, 2, 5, 15, 50, 100, 400, 1600, 6400),
+                    cell.width = 10,
+                    models = c("Nachman", "PL", "Logis", "GNB", "FNB", "Hui"),
+                    plot = FALSE)
Nachman model is running...  complete
PL model is running...  complete
Logis model is running...  complete
GNB model is running...  complete
FNB model is running...  complete
Hui model is running...  complete
$Occupancy
  Cell.area    Nachman        PL      Logis        GNB         FNB
1         1 0.08030822 0.1052773 0.05985936 0.08028227 0.008908909
2         2 0.09736358 0.1219021 0.07665411 0.09733771 0.017281943
3         5 0.12519339 0.1479747 0.10546243 0.12516905 0.039715181
4        15 0.16820070 0.1866865 0.15220476 0.16818092 0.095193389
5        50 0.23008459 0.2408337 0.22156981 0.23007347 0.196529689
6       100 0.27380698 0.2788650 0.27067303 0.27380220 0.265954200
7       400 0.38060345 0.3738932 0.38685570 0.38061083 0.403406870
8      1600 0.51186710 0.5013040 0.51752119 0.51187602 0.522672643
9      6400 0.65827020 0.6721323 0.64583371 0.65825516 0.621741960
        Hui      Means
1 0.1635464 0.06242884
2 0.1681488 0.07975388
3 0.1774062 0.10949177
4 0.1963087 0.15707798
5 0.2347679 0.22516875
6        NA 0.27258720
7        NA 0.38494506
8        NA 0.51299864
9        NA 0.65102374

$AOO
  Cell.area   Nachman        PL     Logis       GNB        FNB      Hui
1         1  30838.36  40426.47  22985.99  30828.39   3421.021 62801.81
2         2  37387.62  46810.42  29435.18  37377.68   6636.266 64569.15
3         5  48074.26  56822.29  40497.57  48064.91  15250.630 68123.98
4        15  64589.07  71687.60  58446.63  64581.47  36554.262 75382.54
5        50  88352.48  92480.13  85082.81  88348.21  75467.401 90150.86
6       100 105141.88 107084.16 103938.44 105140.05 102126.413       NA
7       400 146151.73 143575.00 148552.59 146154.56 154908.238       NA
8      1600 196556.97 192500.74 198728.14 196560.39 200706.295       NA
9      6400 252775.76 258098.80 248000.14 252769.98 238748.913       NA
      Means
1  23972.68
2  30625.49
3  42044.84
4  60317.95
5  86464.80
6 104673.49
7 147818.90
8 196991.48
9 249993.12
hui.downscale
> # downscale とpredict.downscaleの組み合わせ
> (hui <- hui.downscale(atlas.data,
+                       cell.width = 10,
+                       extent = 228900,
+                       new.areas = c(1, 2, 5, 15, 50,75),
+                       plot = FALSE))
$model
[1] "Hui"

$predicted
  Cell.area Occupancy      AOO
1         1 0.2787162 63798.13
2         2 0.2866964 65624.80
3         5 0.3026427 69274.90
4        15 0.3347401 76622.02
5        50 0.3979450 91089.62
6        75 0.4291749 98238.12

$observed
  Cell.area Occupancy
1       100 0.4552206

attr(,"class")
[1] "predict.downscale"
predict.downscale
Arguments
- object
- new.areas
- tolerance
- plot
- ...
upgrain
Arguments
- atlas.data
- cell.width
- scales
- threshold
- method...
All_Sampled,All_Occurrences,Gain_Equals_LossorSampled_Only - plot
- return.rasters
> thresh <- upgrain.threshold(atlas.data = atlas.data,
+                             cell.width = 10,
+                             scales = 3,
+                             thresholds = seq(0, 1, 0.1))
> ## use a specified threshold - method must equal NULL
> upgrain(atlas.data = atlas.data,
+         cell.width= 10,
+         scales = 3,
+         threshold = 0.15,
+         plot = FALSE,
+         method = NULL)
$threshold
[1] 0.15

$extent.stand
[1] 320000

$occupancy.stand
  Cell.area Extent Occupancy
1       100 320000     0.320
2       400 320000     0.455
3      1600 320000     0.555
4      6400 320000     0.700

$occupancy.orig
  Cell.area Extent Occupancy
1       100 228900 0.4552206
2       400 266400 0.5645646
3      1600 312000 0.6102564
4      6400 384000 0.6666667

$atlas.raster.stand
class       : RasterLayer
dimensions  : 104, 64, 6656  (nrow, ncol, ncell)
resolution  : 10, 10  (x, y)
extent      : 8085, 8725, -65, 975  (xmin, xmax, ymin, ymax)
coord. ref. : NA
data source : in memory
names       : layer
values      : 1, 3  (min, max)


attr(,"class")
[1] "upgrain"