tidyr

tidyr速習

tidyrはデータフレームの形状を自由自在に変更するのに役立つパッケージです。messy、散らかったデータをtidy、整然なデータに変換することがtidyrの目的です。tidyデータ形式の詳細はHadley(2014)やこちらが参考にしてください。このほか、データの形状を変更するための関数を提供します。

横長データと縦長データ

データの形状を表現する言葉として、しばしば「横長(あるいは横持ち)」「縦長(あるいは縦持ち)」が使われます。

  • 横長… 変数が列、観測値が行に記録される
  • 縦長… 変数が行、観測値が列に記録される

具体例を見てみましょう。

# 2020年国勢調査での四国4県の男女別人口
df_wide <- 
  tibble(
    area = c("徳島県", "香川県", "愛媛県", "高知県"), 
= c(343265, 459197, 633062, 326531), 
= c(376294, 491047, 701779, 364996))

df_wide
area
徳島県 343265 376294
香川県 459197 491047
愛媛県 633062 701779
高知県 326531 364996

本来、性別として一つの変数で扱えるはずのデータが、という2つの変数に分かれてしいます。こうした横長のデータは、表計算ソフトでの入力には便利ですが、データ分析には不便です。データ分析では、あるいはとして性別を扱うのではなく、性別の項目として男女の違いを扱うことが多いからです。

このデータを縦長形式で表現すると次のようになります。

df_long <- 
  tibble(
  area = rep(c("徳島県", "香川県", "愛媛県", "高知県"), each = 2),
  gender = rep(c("男", "女"), times = 4),
  value = c(343265, 376294, 459197, 491047, 633062, 701779,
            326531, 364996))
df_long
area gender value
徳島県 343265
徳島県 376294
香川県 459197
香川県 491047
愛媛県 633062
愛媛県 701779
高知県 326531
高知県 364996

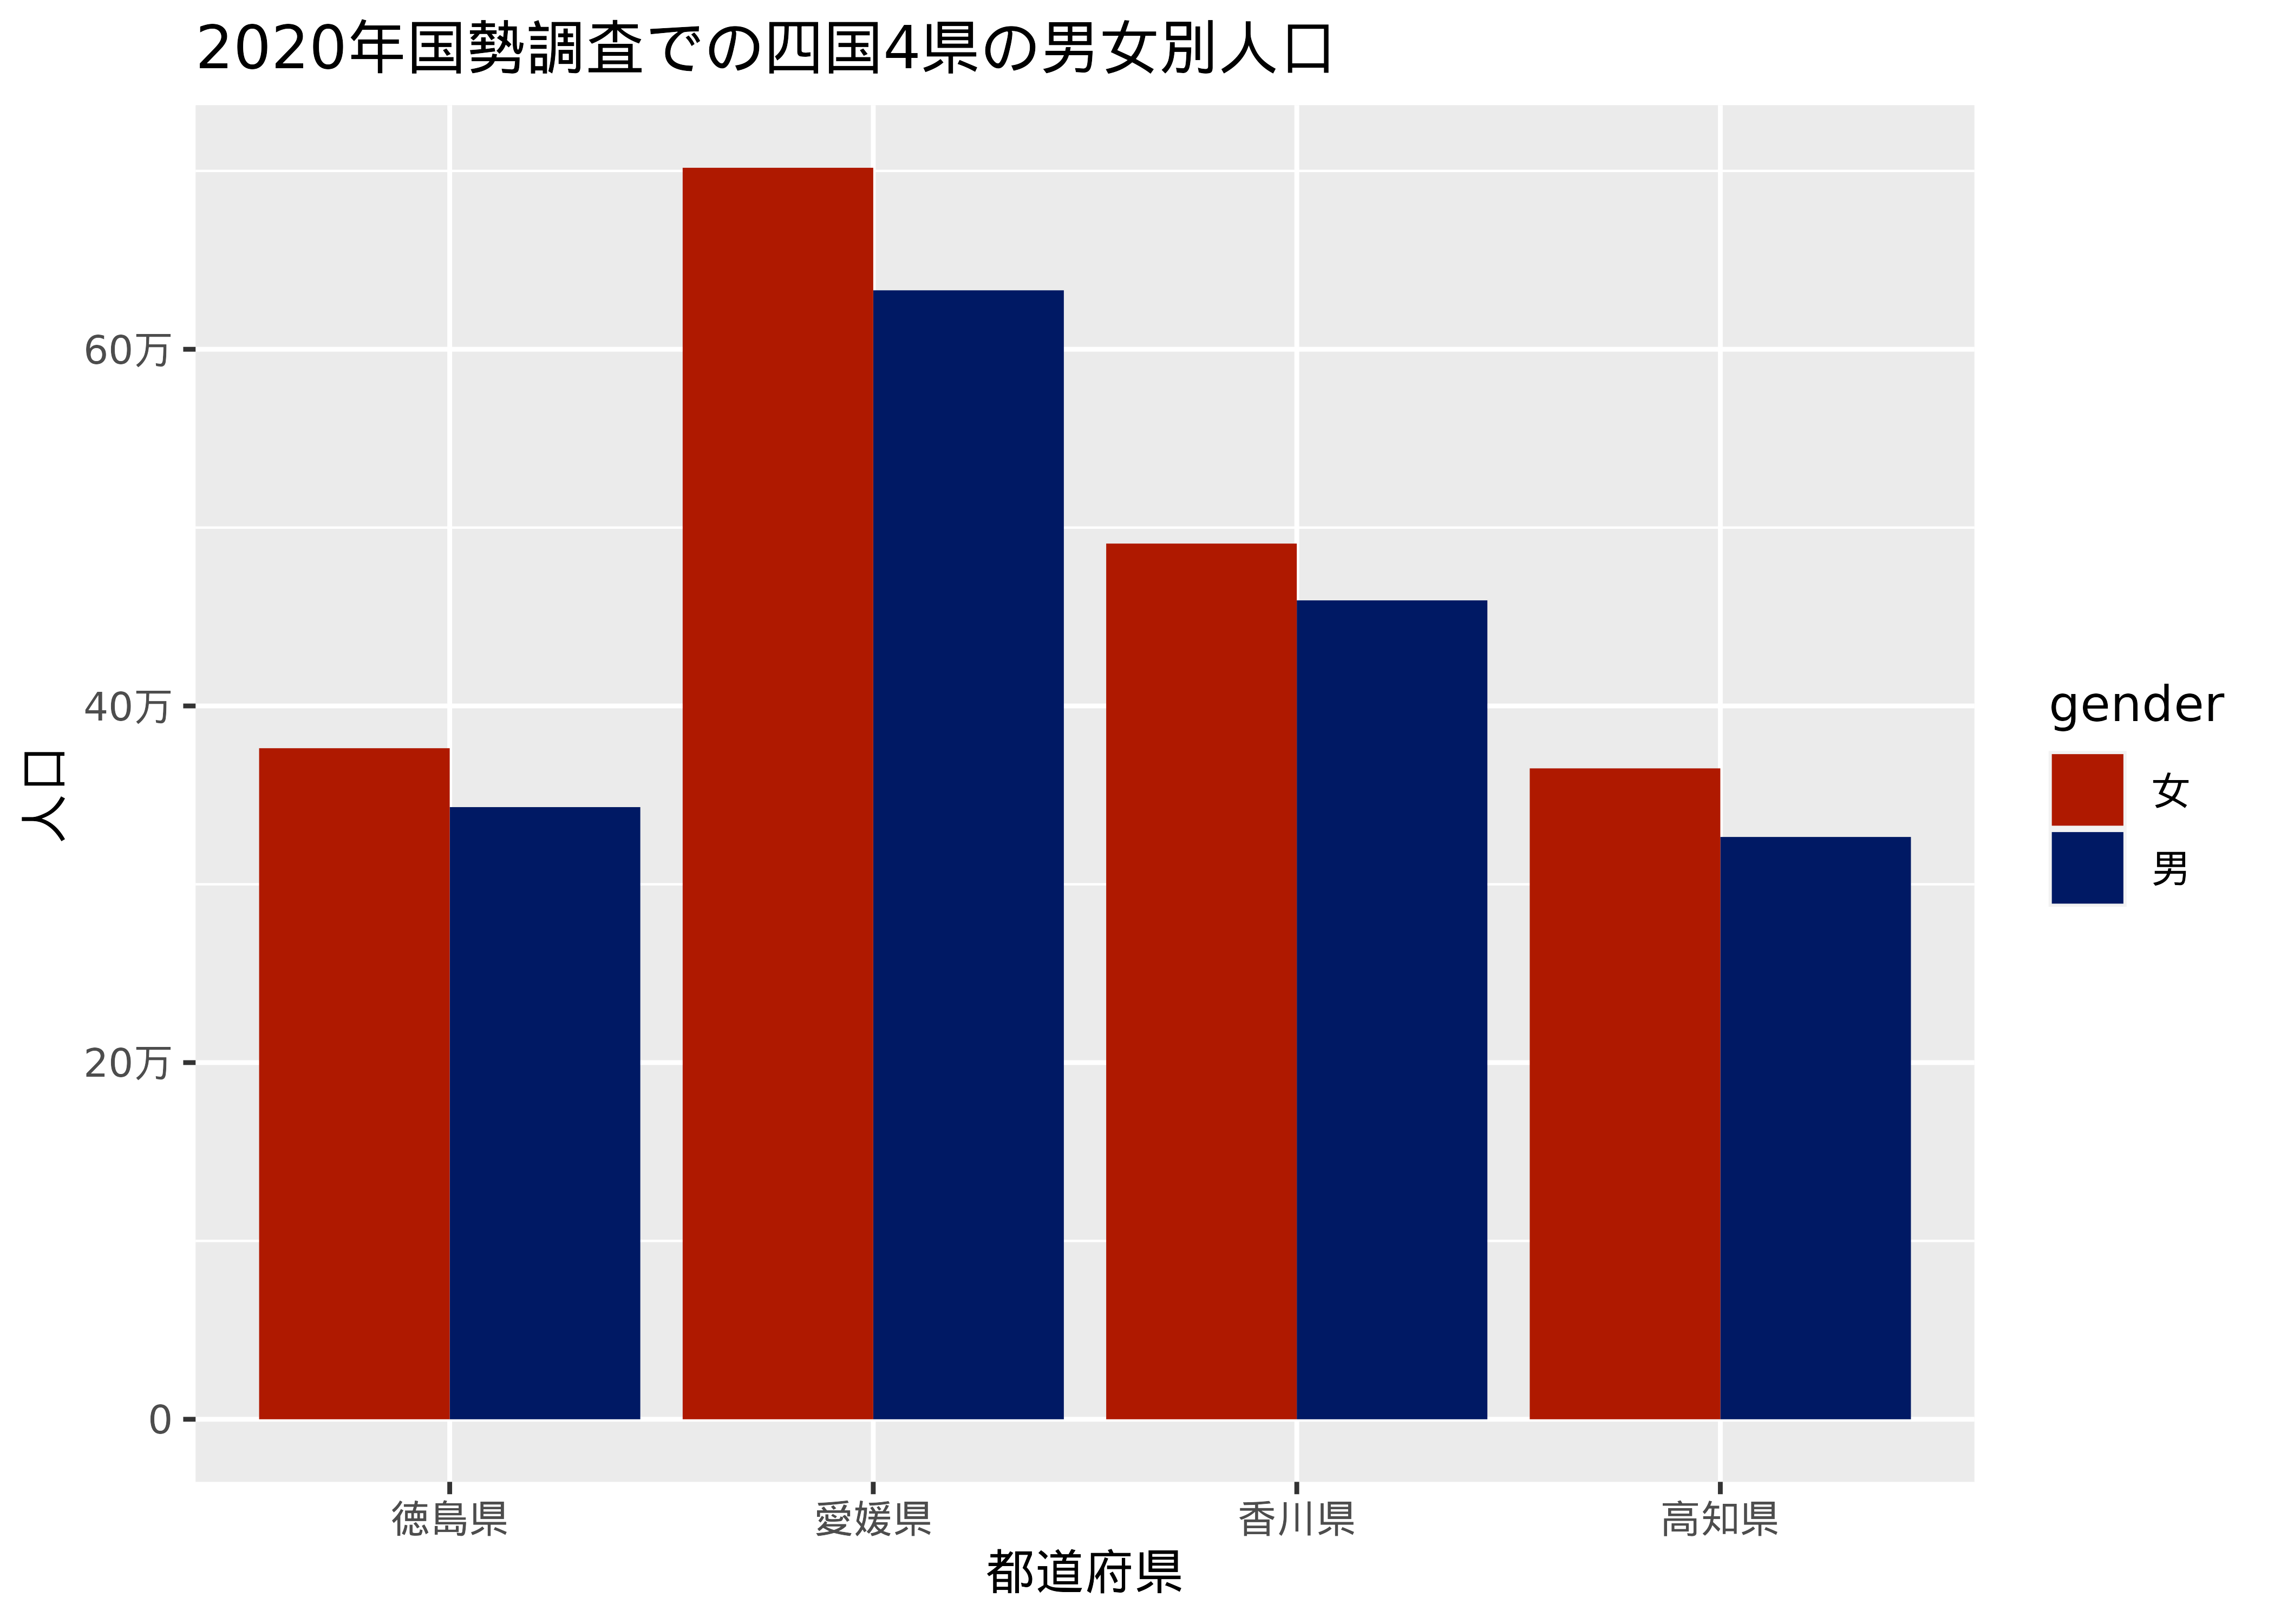
横長データと比べて、縦長データは冗長なようにも見えますが、Rの多くの関数は縦長のデータを好みます。例えばggplot2で性別ごとの人口を棒グラフで表示するには、縦長データを直接利用可能です。

ggplot(df_long) +
    aes(area, value, fill = gender, group = gender) +
    geom_bar(stat = "identity", position = "dodge") +
    scale_fill_manual(values = list(`` = "#001964", `` = "#AF1900")) +
    scale_y_continuous(labels = zipangu::label_kansuji()) +
    labs(title = "2020年国勢調査での四国4県の男女別人口",
         x = "都道府県", y = "人口")

tidyrではこのような縦長・横長のデータ形式の変換を実現する関数が用意されています。縦長データを横長データに変換するにはpivot_wider()を、横長データを縦長データに変換するにはpivot_longer()を利用します。

# 横長から縦長へ
df_wide |> 
  pivot_longer(cols = 2:3, names_to = "gender", values_to = "value")
area gender value
徳島県 343265
徳島県 376294
香川県 459197
香川県 491047
愛媛県 633062
愛媛県 701779
高知県 326531
高知県 364996
# 縦長から横長へ
df_long |> 
  pivot_wider(names_from = gender, values_from = value)
area
徳島県 343265 376294
香川県 459197 491047
愛媛県 633062 701779
高知県 326531 364996

pivot_wider()関数では、対象のデータフレーム中の値と項目を格納する変数名とその値を

既存の変数は引用符をつけずに指定します。一方で、元のデータフレームに存在しない列名を追加する

separate_wider_* / separate_longer_*

tibble(zipcode = c("100-0004", 
                   "700-0027")) |> 
  separate_wider_delim(cols = zipcode, 
                       delim = "-", 
                       names = c("code1", "code2"))
code1 code2
100 0004
700 0027

nest / unnest_wider / unnest_longer

library(jpmesh)
jpmesh::administration_mesh(36, to_mesh_size = 80)
meshcode geometry
5034 POLYGON ((134 33.33333, 135…
5134 POLYGON ((134 34, 135 34, 1…
5133 POLYGON ((133 34, 134 34, 1…
5033 POLYGON ((133 33.33333, 134…
tibble(
  prefcode = str_pad(seq.int(36, 37), width = 2, pad = "0")) %>%
  mutate(meshcode = map(., \(prefcode) jpmesh::administration_mesh(prefcode, to_mesh_size = 80))) |> 
  unnest(cols = meshcode)
prefcode meshcode geometry
36 5034 POLYGON ((134 33.33333, 135…
36 5134 POLYGON ((134 34, 135 34, 1…
36 5133 POLYGON ((133 34, 134 34, 1…
36 5033 POLYGON ((133 33.33333, 134…
37 5034 POLYGON ((134 33.33333, 135…
37 5134 POLYGON ((134 34, 135 34, 1…
37 5133 POLYGON ((133 34, 134 34, 1…
37 5033 POLYGON ((133 33.33333, 134…
zipangu::separate_address("東京都千代田区大手町一丁目")
$prefecture
[1] "東京都"

$city
[1] "千代田区"

$street
[1] "大手町一丁目"
df_address <- 
  tibble(address = c("東京都千代田区大手町一丁目", 
                   "岡山県岡山市北区清心町16-13")) %>%
  mutate(address_components = purrr::pmap(., ~ zipangu::separate_address(..1)))  

df_address |> 
  unnest_wider(col = address_components)
address prefecture city street
東京都千代田区大手町一丁目 東京都 千代田区 大手町一丁目
岡山県岡山市北区清心町16-13 岡山県 岡山市北区 清心町16-13
df_address |> 
  unnest_longer(col = address_components)
address address_components address_components_id
東京都千代田区大手町一丁目 東京都 prefecture
東京都千代田区大手町一丁目 千代田区 city
東京都千代田区大手町一丁目 大手町一丁目 street
岡山県岡山市北区清心町16-13 岡山県 prefecture
岡山県岡山市北区清心町16-13 岡山市北区 city
岡山県岡山市北区清心町16-13 清心町16-13 street

extract

tibble(month = c("令和4年12月", "令和4年11月", 
"令和4年10月", "令和4年9月", "令和4年8月", "令和4年7月"
)) |> 
extract(month,
                   c("year", "month"),
                   "(令和.+年|平成.+年)([0-9]{1,2}月)")
year month
令和4年 12月
令和4年 11月
令和4年 10月
令和4年 9月
令和4年 8月
令和4年 7月

pack / unpack

jmastats

library(jmastats)
df_pack <- 
  jma_collect(item = "monthly", block_no = "47895", year = 2022, month = 1, pack = TRUE)
Data from: https://www.data.jma.go.jp/obd/stats/etrn/view/monthly_s1.php?prec_no=71&block_no=47895&year=2022&month=1&day=&view=Treated as missing: lines 1, 2, 12 at temperature_min(℃)
Treated as missing: lines 1, 2, 3, 4, 5, 6, 7, 8, 9, 10, 11, 12 at solar_irradiance_average(MJ/m^2)
Treated as missing: lines 1, 3, 4, 5, 6, 7, 8, 9, 10, 11 at snow_fall(cm)
Treated as missing: lines 1, 3, 4, 5, 6, 7, 8, 9, 10, 11 at snow_max_fall_day(cm)
Treated as missing: lines 1, 3, 4, 5, 6, 7, 8, 9, 10, 11 at snow_depth(cm)
Treated as missing: lines 1, 2, 3, 4, 5, 6, 7, 8, 9, 10, 11, 12 at cloud_covering_mean
Treated as missing: lines 4, 6, 8, 10 at condition_snow_days
Treated as missing: lines 4, 6, 8, 10 at condition_fog_days
Treated as missing: lines 1, 2, 3, 4, 5, 6, 7, 8, 10, 11, 12 at condition_thunder_days

── Column specification ────────────────────────────────────────────────────────
cols(
  .default = col_double(),
  wind_max_speed_direction = col_character(),
  wind_max_instantaneous_direction = col_character(),
  `solar_irradiance_average(MJ/m^2)` = col_logical(),
  cloud_covering_mean = col_logical()
)
ℹ Use `spec()` for the full column specifications.
df_unpack <- 
  jma_collect(item = "monthly", block_no = "47895", year = 2022, month = 1, pack = FALSE)
glimpse(df_pack)
Rows: 12
Columns: 11
$ month            <dbl> 1, 2, 3, 4, 5, 6, 7, 8, 9, 10, 11, 12
$ atmosphere       <tibble[,2]> <tbl_df[12 x 2]>
$ precipitation    <tibble[,4]> <tbl_df[12 x 4]>
$ temperature      <tibble[,5]> <tbl_df[12 x 5]>
$ humidity         <tibble[,2]> <tbl_df[12 x 2]>
$ wind             <tibble[,5]> <tbl_df[12 x 5]>
$ daylight         <tibble[,1]> <tbl_df[12 x 1]>
$ snow             <tibble[,3]> <tbl_df[12 x 3]>
$ solar_irradiance <tibble[,1]> <tbl_df[12 x 1]>
$ cloud_covering   <tibble[,1]> <tbl_df[12 x 1]>
$ condition        <tibble[,3]> <tbl_df[12 x 3]>
glimpse(df_unpack)
Rows: 12
Columns: 28
$ month                               <dbl> 1, 2, 3, 4, 5, 6, 7, 8, 9, 10, 11,…
$ `atmosphere_land(hPa)`              <dbl> 1019.5, 1020.4, 1016.1, 1015.8, 10…
$ `atmosphere_surface(hPa)`           <dbl> 1020.3, 1021.2, 1016.9, 1016.6, 10…
$ `precipitation_sum(mm)`             <dbl> 22.5, 38.5, 86.0, 94.0, 155.0, 89.…
$ `precipitation_max_per_day(mm)`     <dbl> 14.0, 20.0, 42.0, 30.0, 56.5, 24.5…
$ `precipitation_max_1hour(mm)`       <dbl> 4.5, 3.0, 13.5, 17.0, 15.0, 15.0, …
$ `precipitation_max_10minutes(mm)`   <dbl> 2.0, 1.0, 3.5, 5.0, 4.0, 11.0, 6.5…
$ `temperature_average(℃)`            <dbl> 6.0, 5.5, 11.5, 16.1, 19.6, 23.7, …
$ `temperature_average_max(℃)`        <dbl> 9.7, 9.5, 15.9, 20.6, 24.0, 27.7, …
$ `temperature_average_min(℃)`        <dbl> 2.7, 1.9, 7.4, 12.1, 15.4, 20.2, 2…
$ `temperature_max(℃)`                <dbl> 13.6, 14.6, 21.4, 27.0, 30.2, 34.7…
$ `temperature_min(℃)`                <dbl> -0.5, -1.2, 2.5, 5.8, 10.0, 15.5, …
$ `humidity_average(%)`               <dbl> 61, 59, 66, 69, 67, 77, 79, 77, 77…
$ `humidity_min(%)`                   <dbl> 34, 25, 18, 9, 19, 40, 42, 43, 31,…
$ `wind_average_speed(m/s)`           <dbl> 3.3, 3.4, 2.9, 2.9, 2.8, 2.7, 3.2,…
$ `wind_max_speed(m/s)`               <dbl> 8.9, 10.2, 12.2, 9.0, 8.7, 12.5, 8…
$ wind_max_speed_direction            <chr> "北西", "西北西", "南南東", "南南…
$ `wind_max_instantaneous_speed(m/s)` <dbl> 15.6, 19.1, 20.5, 16.1, 15.0, 21.0…
$ wind_max_instantaneous_direction    <chr> "北西", "西", "南南東", "西北西", …
$ `daylight_(h)`                      <dbl> 165.2, 190.2, 193.8, 210.3, 208.4,…
$ `solar_irradiance_average(MJ/m^2)`  <lgl> NA, NA, NA, NA, NA, NA, NA, NA, NA…
$ `snow_fall(cm)`                     <dbl> 0, 6, 0, 0, 0, 0, 0, 0, 0, 0, 0, 11
$ `snow_max_fall_day(cm)`             <dbl> 0, 3, 0, 0, 0, 0, 0, 0, 0, 0, 0, 11
$ `snow_depth(cm)`                    <dbl> 0, 6, 0, 0, 0, 0, 0, 0, 0, 0, 0, 10
$ cloud_covering_mean                 <lgl> NA, NA, NA, NA, NA, NA, NA, NA, NA…
$ condition_snow_days                 <dbl> 3, 6, 0, 0, 0, 0, 0, 0, 0, 0, 0, 5
$ condition_fog_days                  <dbl> 0, 0, 0, 2, 0, 0, 0, 0, 0, 0, 0, 0
$ condition_thunder_days              <dbl> 0, 0, 0, 2, 0, 4, 7, 17, 8, 3, 1, 0
df_pack |> 
  select(month, precipitation) |> 
  unnest(cols = precipitation)
month sum(mm) max_per_day(mm) max_1hour(mm) max_10minutes(mm)
1 22.5 14.0 4.5 2.0
2 38.5 20.0 3.0 1.0
3 86.0 42.0 13.5 3.5
4 94.0 30.0 17.0 5.0
5 155.0 56.5 15.0 4.0
6 89.5 24.5 15.0 11.0
7 124.0 43.5 16.0 6.5
8 62.5 14.5 14.5 10.0
9 283.0 117.5 48.0 19.5
10 80.5 24.5 11.5 5.5
11 82.0 23.5 6.0 3.0
12 33.0 9.5 3.5 1.5
df_unpack |> 
  select(month, starts_with("precipitation"))
month precipitation_sum(mm) precipitation_max_per_day(mm) precipitation_max_1hour(mm) precipitation_max_10minutes(mm)
1 22.5 14.0 4.5 2.0
2 38.5 20.0 3.0 1.0
3 86.0 42.0 13.5 3.5
4 94.0 30.0 17.0 5.0
5 155.0 56.5 15.0 4.0
6 89.5 24.5 15.0 11.0
7 124.0 43.5 16.0 6.5
8 62.5 14.5 14.5 10.0
9 283.0 117.5 48.0 19.5
10 80.5 24.5 11.5 5.5
11 82.0 23.5 6.0 3.0
12 33.0 9.5 3.5 1.5